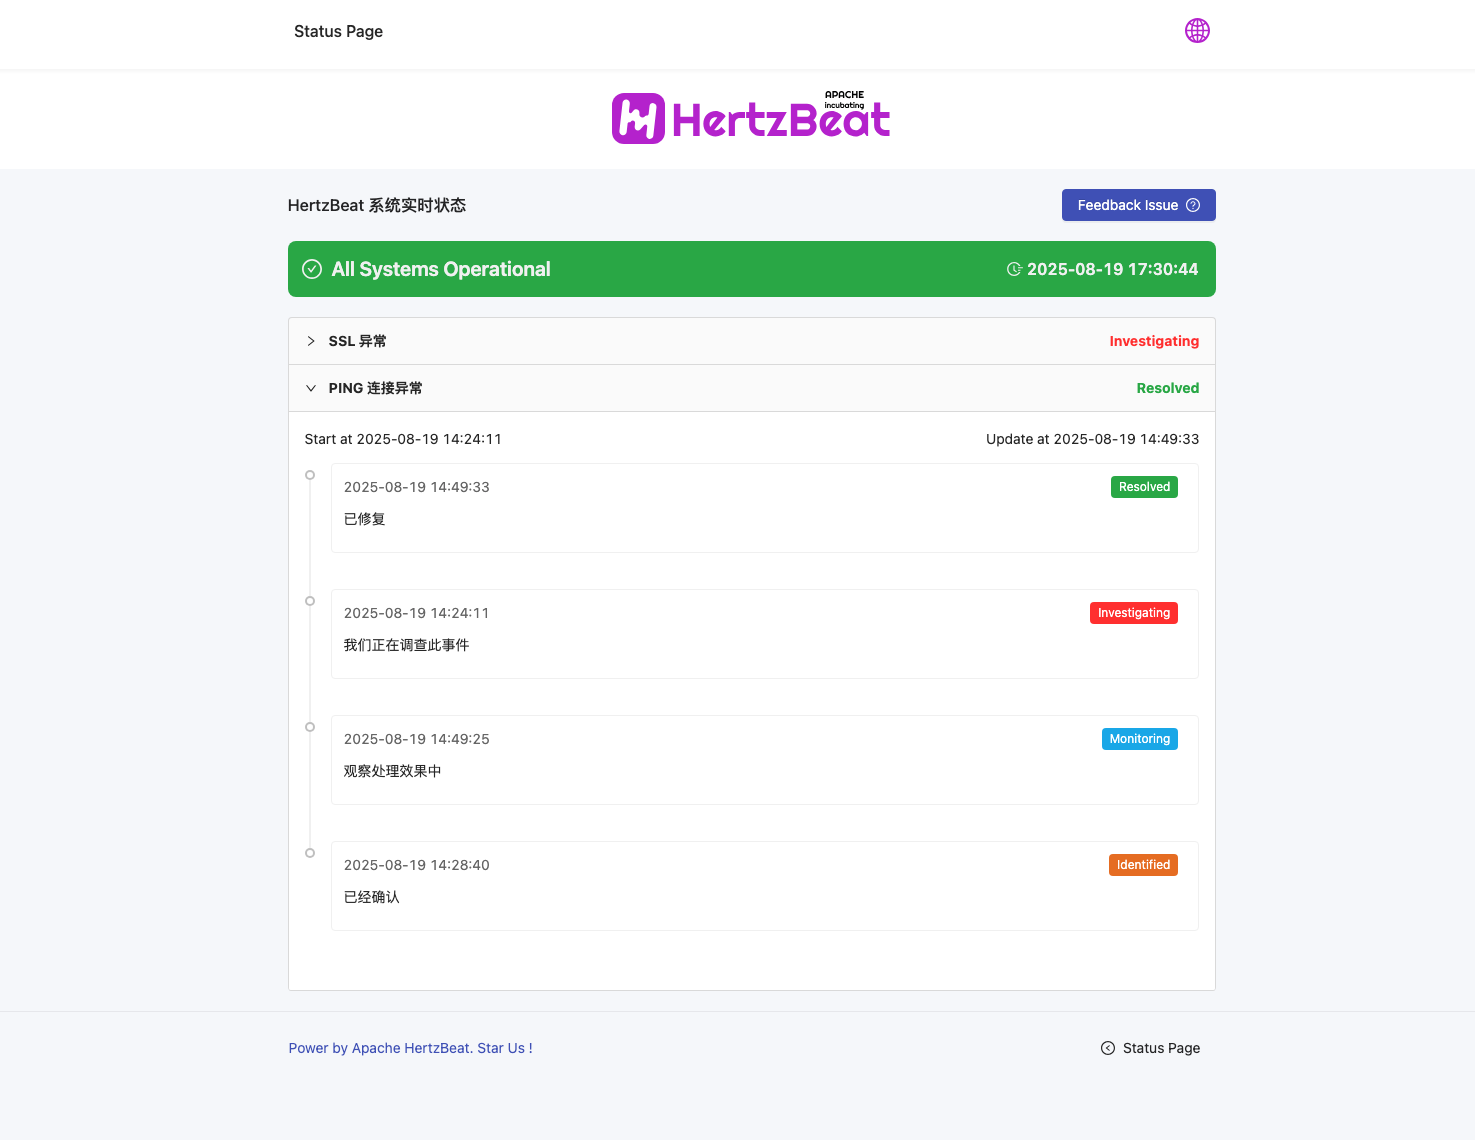
Status Page
Quickly build a powerful status page with HertzBeat to easily communicate the real-time status of your product services to users. For example, see GitHub's service status page https://www.githubstatus.com.
It supports the linkage synchronization between component status and monitoring status, provides a fault event maintenance management mechanism, and more. This enhances your transparency and professionalism, builds user trust, and reduces communication costs.
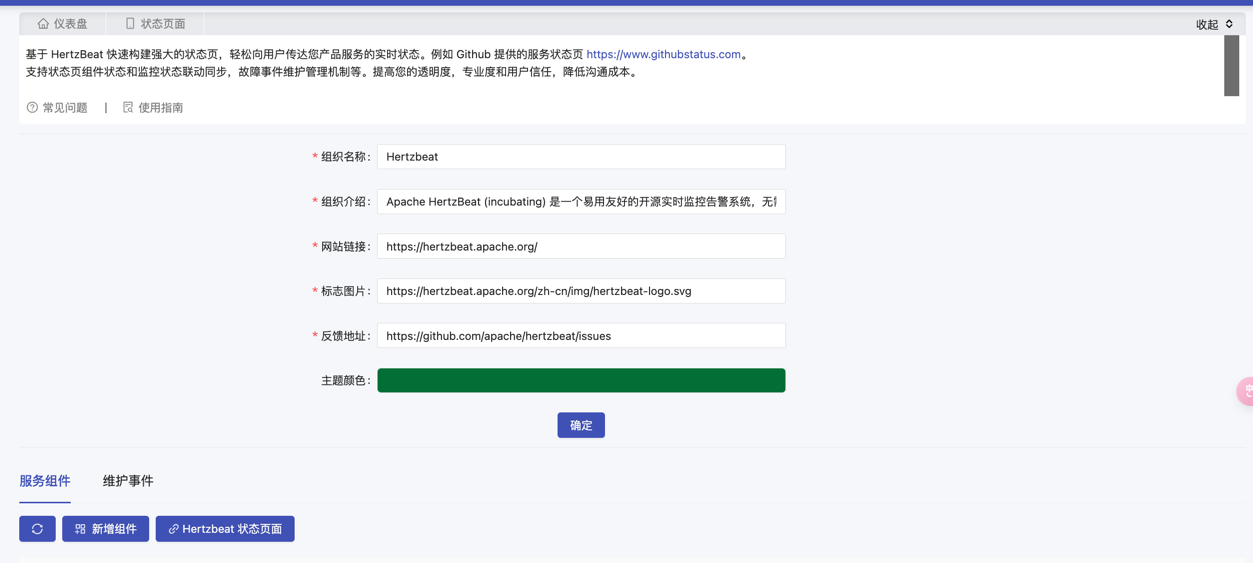
1. Set Organization Information
The fields that need to be filled in are as follows:
| Field Name | Field Description | Example |
|---|---|---|
| Organization Name | Name of the organization | HertzBeat |
| Organization Description | Detailed description of the organization | Apache HertzBeat is an easy-to-use and user-friendly open-source real-time monitoring and alerting system, no agent required, high-performance cluster, compatible with Prometheus, providing powerful custom monitoring and status page building capabilities. |
| Website Link | URL of the organization's website for more information | https://hertzbeat.apache.org/ |
| Logo Image | Path or URL of the organization's official logo image, preferably in .svg format | https://hertzbeat.apache.org/zh-cn/img/hertzbeat-logo.svg |
| Feedback Address | Address to receive feedback | https://github.com/apache/hertzbeat/issues |
| Theme Color | Main color tone of the status page | Click to select on the page |
After filling in the organization information, click Confirm.
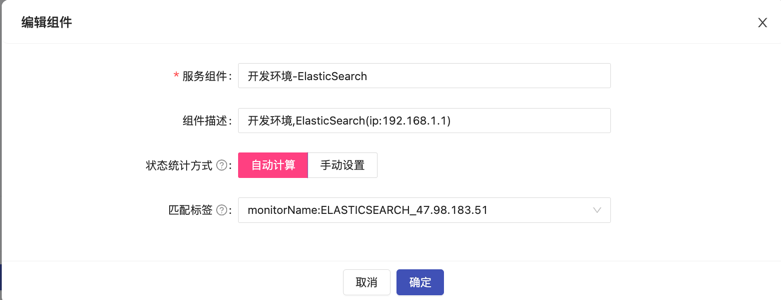
2. Add Component
After adding a component, the status page will display the status information of the component.
Click Add Component to add the component to be monitored and fill in the following fields:
| Field Name | Field Description | Example |
|---|---|---|
| Service Component | Name of the component service | Development Environment ElasticSearch |
| Component Description | Detailed description of the component service | Development environment, ElasticSearch (ip:192.168.1.1) |
| Service Status Calculation Method | Method of calculating the service status of the component. Automatic Calculation: Automatically calculate the status based on the monitored status of the component. Manual Setting: Manually configure the component status. | Automatic Calculation / Manual Setting (Choose one) |
| Matching Tag | Status calculation associated tag, use the availability status data of all monitors associated with the tag to calculate the service status of the component. | Select the component tag on the page |
Set Status Calculation Time
Note: The service status is calculated every 300 seconds by default.
Modify application.yml:
status:
  calculate:
    interval: 60
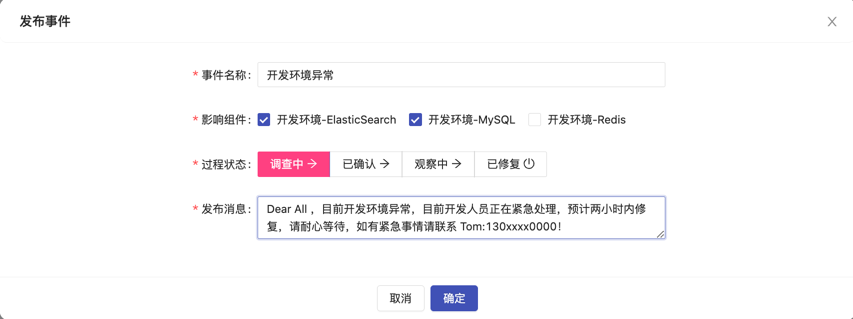
3. Maintain Events
When an event occurs, you can publish a notification on the status page.
Click Publish Event
| Field Name | Field Description | Example |
|---|---|---|
| Event Name | Title of the event, should clearly reflect the core content of the event | "Server Downtime Event - April 5, 2023" |
| Affected Component | Select the components affected by this event | Select on the page |
| Process Status | Set the current status of the event for tracking the progress. Optional values: Investigating / Confirmed / Monitoring / Resolved | Confirmed |
| Publish Message | Official notification to convey to relevant parties, including event details, impact assessment, and countermeasures | Dear All, there is an issue with the development environment, the developers are urgently handling it, it is expected to be fixed within two hours. Please be patient, if you have urgent matters, please contact Tom: 130xxxx0000! |
Note: You can publish messages multiple times to keep the team updated on the current status.