SNMP Protocol Custom Monitoring
From Custom Monitoring, you are familiar with how to customize types, Metrics, protocols, etc. Here we will introduce in detail how to use SNMP to customize Metric monitoring. JMX protocol custom monitoring allows us to easily monitor Metrics we want by config SNMP MIB OIDs.
SNMP protocol collection process
【Peer Server Enable SNMP Service】->【HertzBeat Connect Peer Server SNMP】->【Query Oids Data】->【Metric data extraction】
It can be seen from the process that we define a monitoring type of Snmp protocol. We need to configure Snmp request parameters, configure which Metrics to obtain, and configure oids.
Data parsing method
By configuring the metrics field, aliasFields, and oids under the snmp protocol of the monitoring template YML to capture the data specified by the peer and parse the mapping.
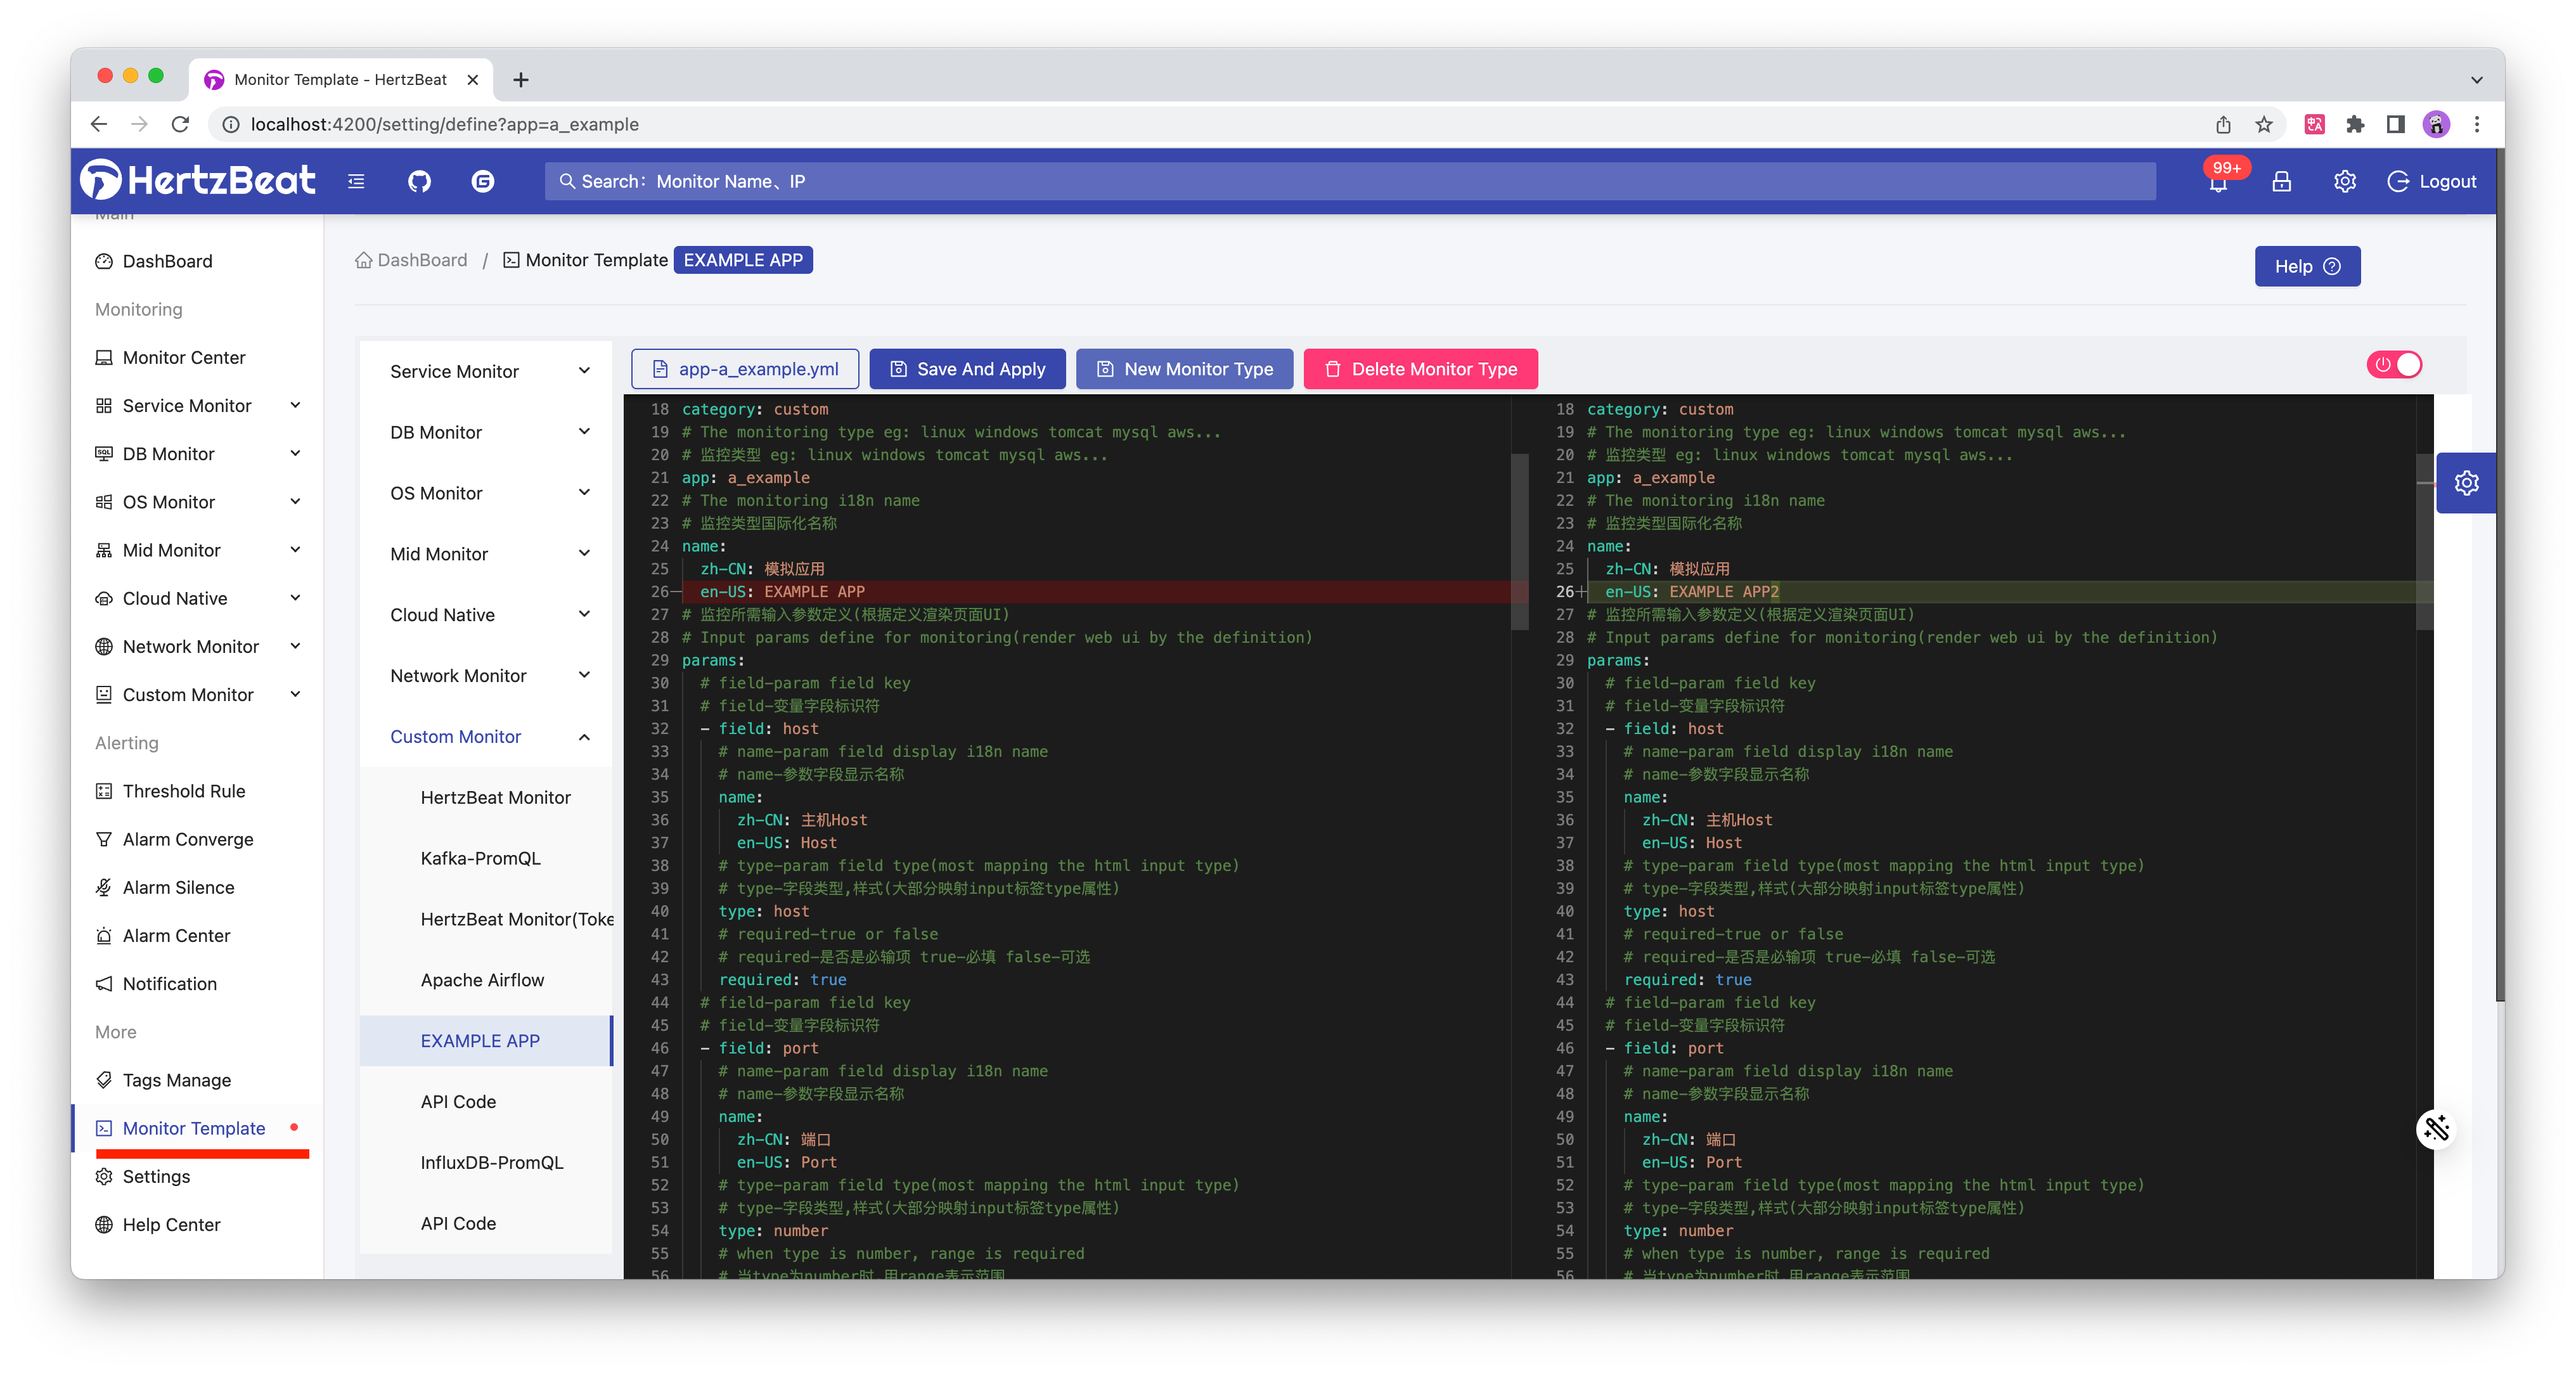
Custom Steps
HertzBeat Dashboard -> Monitoring Templates -> New Template -> Config Monitoring Template Yml -> Save and Apply -> Add A Monitoring with The New Monitoring Type
Configuration usages of the monitoring templates yml are detailed below.
Monitoring Templates YML
We define all monitoring collection types (mysql,jvm,k8s) as yml monitoring templates, and users can import these templates to support corresponding types of monitoring.
Monitoring template is used to define the name of monitoring type(international), request parameter mapping, index information, collection protocol configuration information, etc.
eg:Define a custom monitoring type app named example_windows which use the SNMP protocol to collect data.
# The monitoring type category:service-application service monitoring db-database monitoring mid-middleware custom-custom monitoring os-operating system monitoring
category: os
# The monitoring type eg: linux windows tomcat mysql aws...
app: windows
# The monitoring i18n name
name:
  zh-CN: Windows操作系统
  en-US: OS Windows
# Input params define for monitoring(render web ui by the definition)
params:
  # field-param field key
  - field: host
    # name-param field display i18n name
    name:
      zh-CN: 主机Host
      en-US: Host
    # type-param field type(most mapping the html input type)
    type: host
    # required-true or false
    required: true
  # field-param field key
  - field: port
    # name-param field display i18n name
    name:
      zh-CN: 端口
      en-US: Port
    # type-param field type(most mapping the html input type)
    type: number
    # when type is number, range is required
    range: '[0,65535]'
    # required-true or false
    required: true
    # default value
    defaultValue: 161
  # field-param field key
  - field: version
    # name-param field display i18n name
    name:
      zh-CN: SNMP 版本
      en-US: SNMP Version
    # type-param field type(radio mapping the html radio tag)
    type: radio
    # required-true or false
    required: true
    # when type is radio checkbox, use option to show optional values {name1:value1,name2:value2}
    options:
      - label: SNMPv1
        value: 0
      - label: SNMPv2c
        value: 1
  # field-param field key
  - field: community
    # name-param field display i18n name
    name:
      zh-CN: SNMP 团体字
      en-US: SNMP Community
    # type-param field type(most mapping the html input type)
    type: text
    # when type is text, use limit to limit string length
    limit: 100
    # required-true or false
    required: true
    # param field input placeholder
    placeholder: 'Snmp community for v1 v2c'
  # field-param field key
  - field: timeout
    # name-param field display i18n name
    name:
      zh-CN: 超时时间(ms)
      en-US: Timeout(ms)
    # type-param field type(most mapping the html input type)
    type: number
    # when type is number, range is required
    range: '[0,100000]'
    # required-true or false
    required: false
    # hide-is hide this field and put it in advanced layout
    hide: true
    # default value
    defaultValue: 6000
# collect metrics config list
metrics:
  # metrics - system
  - name: system
    # metrics scheduling priority(0->127)->(high->low), metrics with the same priority will be scheduled in parallel
    # priority 0's metrics is availability metrics, it will be scheduled first, only availability metrics collect success will the scheduling continue
    priority: 0
    # collect metrics content
    fields:
      # field-metric name, type-metric type(0-number,1-string), unit-metric unit('%','ms','MB'), label-if is metrics label
      - field: name
        type: 1
      - field: descr
        type: 1
      - field: uptime
        type: 1
      - field: numUsers
        type: 0
      - field: services
        type: 0
      - field: processes
        type: 0
      - field: responseTime
        type: 0
        unit: ms
      - field: location
        type: 1
    # the protocol used for monitoring, eg: sql, ssh, http, telnet, wmi, snmp, sdk
    protocol: snmp
    # the config content when protocol is snmp
    snmp:
      # server host: ipv4 ipv6 domain
      host: ^_^host^_^
      # server port
      port: ^_^port^_^
      # snmp connect timeout
      timeout: ^_^timeout^_^
      # snmp community
      community: ^_^community^_^
      # snmp version
      version: ^_^version^_^
      # snmp operation: get, walk
      operation: get
      # metrics oids: metric_name - oid_value
      oids:
        name: 1.3.6.1.2.1.1.5.0
        descr: 1.3.6.1.2.1.1.1.0
        uptime: 1.3.6.1.2.1.25.1.1.0
        numUsers: 1.3.6.1.2.1.25.1.5.0
        services: 1.3.6.1.2.1.1.7.0
        processes: 1.3.6.1.2.1.25.1.6.0
        location: 1.3.6.1.2.1.1.6.0