Quick Tutorial Customize and adapt a monitoring based on HTTP protocol
Through this tutorial, we describe step by step how to customize and adapt a monitoring type based on the http protocol under the Apache HertzBeat.
Before reading this tutorial, we hope that you are familiar with how to customize types, metrics, protocols, etc. from Custom Monitoring and Http Protocol Customization.
HTTP protocol parses the general response structure to obtain metrics data
In many scenarios, we need to monitor the provided HTTP API interface and obtain the index value returned by the interface. In this article, we use the http custom protocol to parse our common http interface response structure, and obtain the fields in the returned body as metric data.
{
   "code": 200,
   "msg": "success",
   "data": {}
}
As above, usually our background API interface will design such a general return. The same is true for the background of the hertzbeat system. Today, we will use the hertzbeat API as an example, add a new monitoring type hertzbeat, and monitor and collect its system summary statistics API
http://localhost:1157/api/summary, the response data is:
{
   "msg": null,
   "code": 0,
   "data": {
     "apps": [
       {
         "category": "service",
         "app": "jvm",
         "status": 0,
         "size": 2,
         "availableSize": 0,
         "unManageSize": 2,
         "unAvailableSize": 0,
         "unReachableSize": 0
       },
       {
         "category": "service",
         "app": "website",
         "status": 0,
         "size": 2,
         "availableSize": 0,
         "unManageSize": 2,
         "unAvailableSize": 0,
         "unReachableSize": 0
       }
     ]
   }
}
This time we get the metrics data such as category, app, status, size, availableSize under the app.
Add Monitoring Template Yml
HertzBeat Dashboard -> Monitoring Templates -> New Template -> Config Monitoring Template Yml -> Save and Apply -> Add A Monitoring with The New Monitoring Type
We define all monitoring collection types (mysql,jvm,k8s) as yml monitoring templates, and users can import these templates to support corresponding types of monitoring.
Monitoring template is used to define the name of monitoring type(international), request parameter mapping, index information, collection protocol configuration information, etc.
Here we define a custom monitoring type app named hertzbeat which use the HTTP protocol to collect data.
Monitoring Templates -> Config New Monitoring Template Yml -> Save and Apply
# The monitoring type category:service-application service monitoring db-database monitoring custom-custom monitoring os-operating system monitoring
category: custom
# The monitoring type eg: linux windows tomcat mysql aws...
app: hertzbeat
# The monitoring i18n name
name:
  zh-CN: HertzBeat监控系统
  en-US: HertzBeat Monitor
# The description and help of this monitoring type
help:
  zh-CN: HertzBeat 对 HertzBeat 监控系统的通用指标进行测量监控。`<br>`您可以点击 “`<i>`新建 HertzBeat监控系统`</i>`” 并进行配置,或者选择“`<i>`更多操作`</i>`”,导入已有配置。
  en-US: HertzBeat monitors HertzBeat Monitor through general performance metric. You could click the "`<i>`New HertzBeat Monitor`</i>`" button and proceed with the configuration or import an existing setup through the "`<i>`More Actions`</i>`" menu.
  zh-TW: HertzBeat對HertzBeat監控系統的通用名額進行量測監控。`<br>`您可以點擊“`<i>`新建HertzBeat監控系統`</i>`”並進行配寘,或者選擇“`<i>`更多操作`</i>`”,導入已有配寘。
helpLink:
  zh-CN: https://hertzbeat.apache.org/zh-cn/docs/help/hertzbeat
  en-US: https://hertzbeat.apache.org/docs/help/hertzbeat
# Input params define for monitoring(render web ui by the definition)
params:
  # field-param field key
  - field: host
    # name-param field display i18n name
    name:
      zh-CN: 主机Host
      en-US: Host
    # type-param field type(most mapping the html input type)
    type: host
    # required-true or false
    required: true
  # field-param field key
  - field: port
    # name-param field display i18n name
    name:
      zh-CN: 端口
      en-US: Port
    # type-param field type(most mapping the html input type)
    type: number
    # when type is number, range is required
    range: '[0,65535]'
    # required-true or false
    required: true
    # default value
    defaultValue: 1157
  - field: ssl
    name:
      zh-CN: 启用HTTPS
      en-US: HTTPS
    type: boolean
    required: true
  - field: timeout
    name:
      zh-CN: 超时时间(ms)
      en-US: Timeout(ms)
    type: number
    required: false
    hide: true
  - field: authType
    name:
      zh-CN: 认证方式
      en-US: Auth Type
    type: radio
    required: false
    hide: true
    options:
      - label: Basic Auth
        value: Basic Auth
      - label: Digest Auth
        value: Digest Auth
  - field: username
    name:
      zh-CN: 用户名
      en-US: Username
    type: text
    limit: 50
    required: false
    hide: true
  - field: password
    name:
      zh-CN: 密码
      en-US: Password
    type: password
    required: false
    hide: true
metrics:
  # the first metrics summary
  # attention: Built-in monitoring metrics contains (responseTime - Response time)
  - name: summary
    # metrics scheduling priority(0->127)->(high->low), metrics with the same priority will be scheduled in parallel
    # priority 0's metrics is availability metrics, it will be scheduled first, only availability metrics collect success will the scheduling continue
    priority: 0
    # collect metrics content
    fields:
      # metrics content contains field-metric name, type-metric type:0-number,1-string, label-if is metrics label, unit-metric unit('%','ms','MB')
      - field: app
        type: 1
        label: true
      - field: category
        type: 1
      - field: status
        type: 0
      - field: size
        type: 0
      - field: availableSize
        type: 0
    #  the protocol used for monitoring, eg: sql, ssh, http, telnet, wmi, snmp, sdk, we use HTTP protocol here
    protocol: http
    # the config content when protocol is http
    http:
      # http host: ipv4 ipv6 domain
      host: ^_^host^_^
      # http port
      port: ^_^port^_^
      # http url, we don't need to enter a parameter here, just set the fixed value to /api/summary
      url: /api/summary
      timeout: ^_^timeout^_^
      # http method: GET POST PUT DELETE PATCH, default fixed value is GET
      method: GET
      # if enabled https, default value is false
      ssl: ^_^ssl^_^
      # http auth
      authorization:
        # http auth type: Basic Auth, Digest Auth, Bearer Token
        type: ^_^authType^_^
        basicAuthUsername: ^_^username^_^
        basicAuthPassword: ^_^password^_^
        digestAuthUsername: ^_^username^_^
        digestAuthPassword: ^_^password^_^
      # http response data parse type: default-hertzbeat rule, jsonpath-jsonpath script, website-for website monitoring, we use jsonpath to parse response data here
      parseType: jsonPath
      parseScript: '$.data.apps.*'
The addition is complete, now we restart the hertzbeat system. We can see that the system page has added a hertzbeat monitoring type.
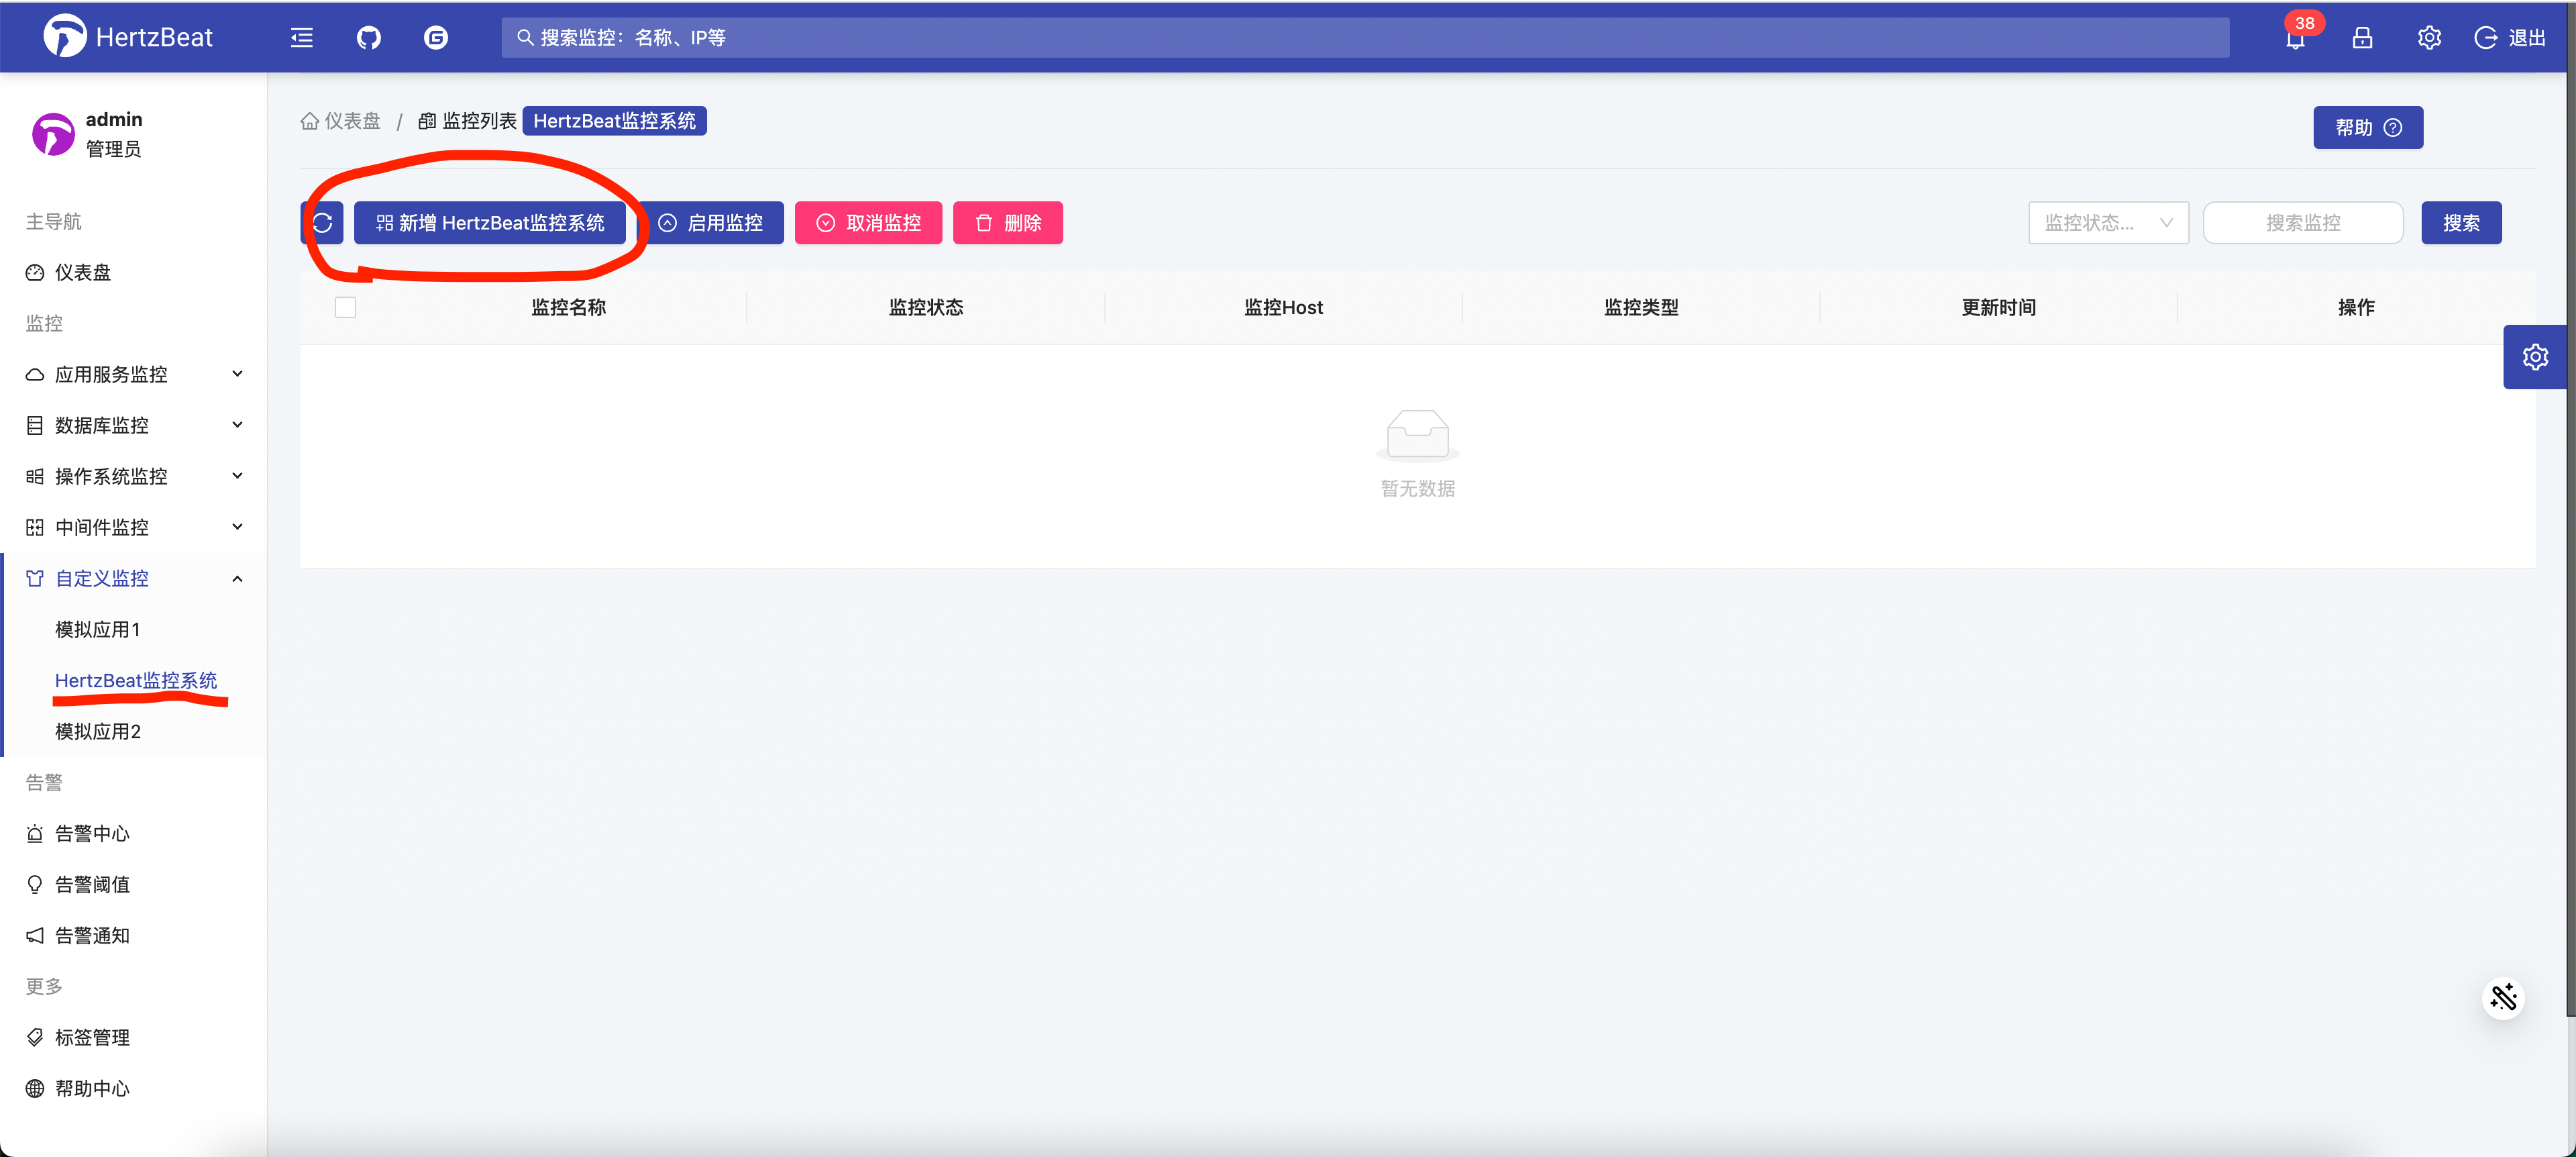
The system page adds the monitoring of hertzbeat monitoring type
We click Add
HertzBeat Monitoring Tool, configure monitoring IP, port, collection cycle, account password in advanced settings, etc., click OK to add monitoring.


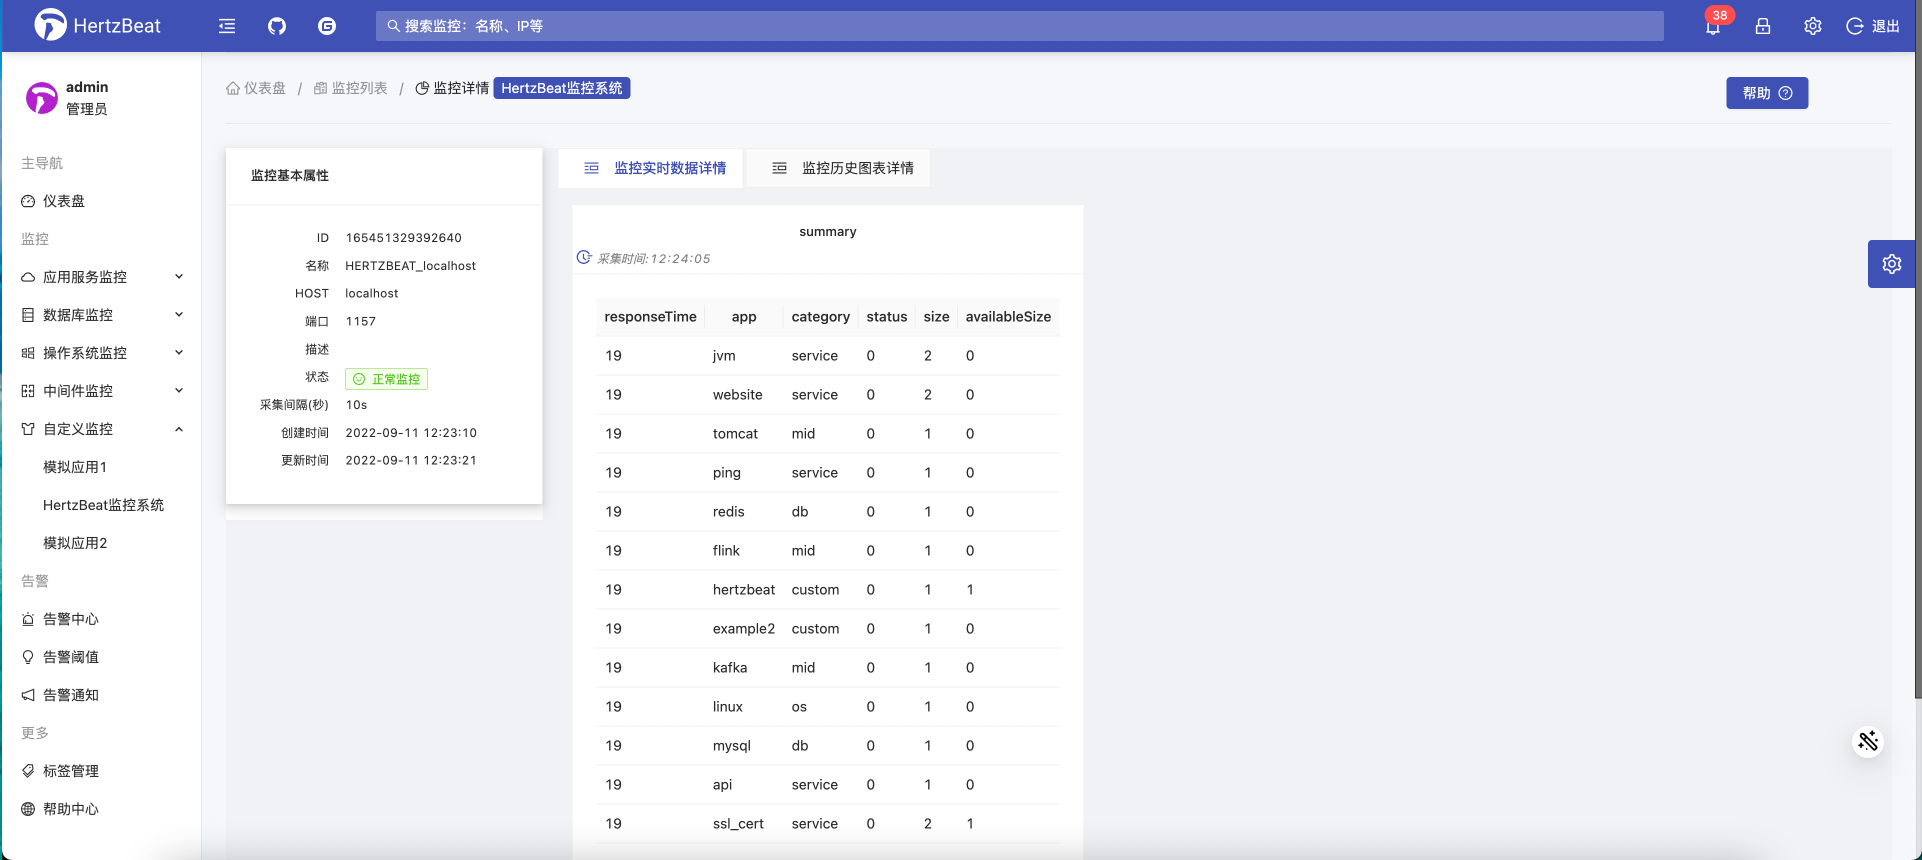
After a certain period of time (depending on the collection cycle), we can see the specific metric data and historical charts in the monitoring details!
Set threshold alarm notification
Next, we can set the threshold normally. After the alarm is triggered, we can view it in the alarm center, add a new recipient, set alarm notification, etc. Have Fun!!!
over
This is the end of the practice of custom monitoring of the HTTP protocol. The HTTP protocol also has other parameters such as headers and params. We can define it like postman, and the playability is also very high!
If you think hertzbeat is a good open source project, please star us on GitHub Gitee, thank you very much. Thanks for the old iron support. Refill!