NGQL Custom Monitoring
From Custom Monitoring, you are familiar with how to customize types, Metrics, protocols, etc. Here we will introduce in detail how to use JDBC(support mysql,mariadb,postgresql,sqlserver at present) to customize Metric monitoring. NGQL custom monitoring allows us to easily query metric data from the NebulaGraph graph database using NGQL or OpenCypher, supporting NebulaGraph 3.X versions.
Data Parsing Methods
Mapping the fields returned by NGQL queries to the metrics we need allows us to obtain corresponding metric data. Currently, there are four mapping and parsing methods: filterCount, oneRow, multiRow, columns.
filterCount
Counts the number of results returned by a query based on specified fields, usually used in
SHOW ...statements. If NGQL statements can directly return the count, it is recommended to use NGQL statements for counting.
Syntax for thecommandsfield: aliasField#NGQL#filterName#filterValue
aliasField: corresponds to the value in thealiasFieldsin the monitoring template
NGQL: query statement
filterName: filter attribute name (optional)
filterValue: filter attribute value (optional)
For example:
- online_meta_count#SHOW HOSTS META#Status#ONLINE
Counts the number of rows returned bySHOW HOSTS METAwhere Status equals ONLINE. - online_meta_count#SHOW HOSTS META##
Counts the number of rows returned bySHOW HOSTS META.
oneRow
Queries a single row of data by mapping the column names of the query result set to the queried fields.
For example:
- Metrics fields: a, b
- NGQL query: match (v:metrics) return v.metrics.a as a, v.metrics.b as b;
Here, the metric fields can be mapped to the response data row by row.
Notes:
- When using the
oneRowmethod, if a single query statement returns multiple rows of results, only the first row of results will be mapped to the metric fields. - When the
commandsfield contains two or more query statements and the returned fields of multiple query statements are the same, the fields returned by the subsequent statement will overwrite those returned by the previous statement. - It is recommended to use the limit statement to limit the number of rows returned in the result set when defining
commands.
multiRow
Queries multiple rows of data by mapping the column names of the query result set to the queried fields.
For example:
- Metrics fields: a, b
- NGQL query: match (v:metrics) return v.metrics.a as a, v.metrics.b as b;
Here, the metric fields can be mapped to the response data row by row. Notes:
- When using the
multiRowmethod, thecommandsfield can only contain one query statement.
columns
Collects a single row of metric data by mapping two columns of data (key-value), where the key matches the queried fields and the value is the value of the queried field.
Notes:
- When using the
columnsmethod, the first two columns of the result set are mapped to collect data by default, where the first column corresponds to the metric name and the second column corresponds to the metric value. - When the
commandsfield contains two or more query statements and the first column of data returned by multiple query statements is duplicated, the result of the last statement will be retained.
Customization Steps
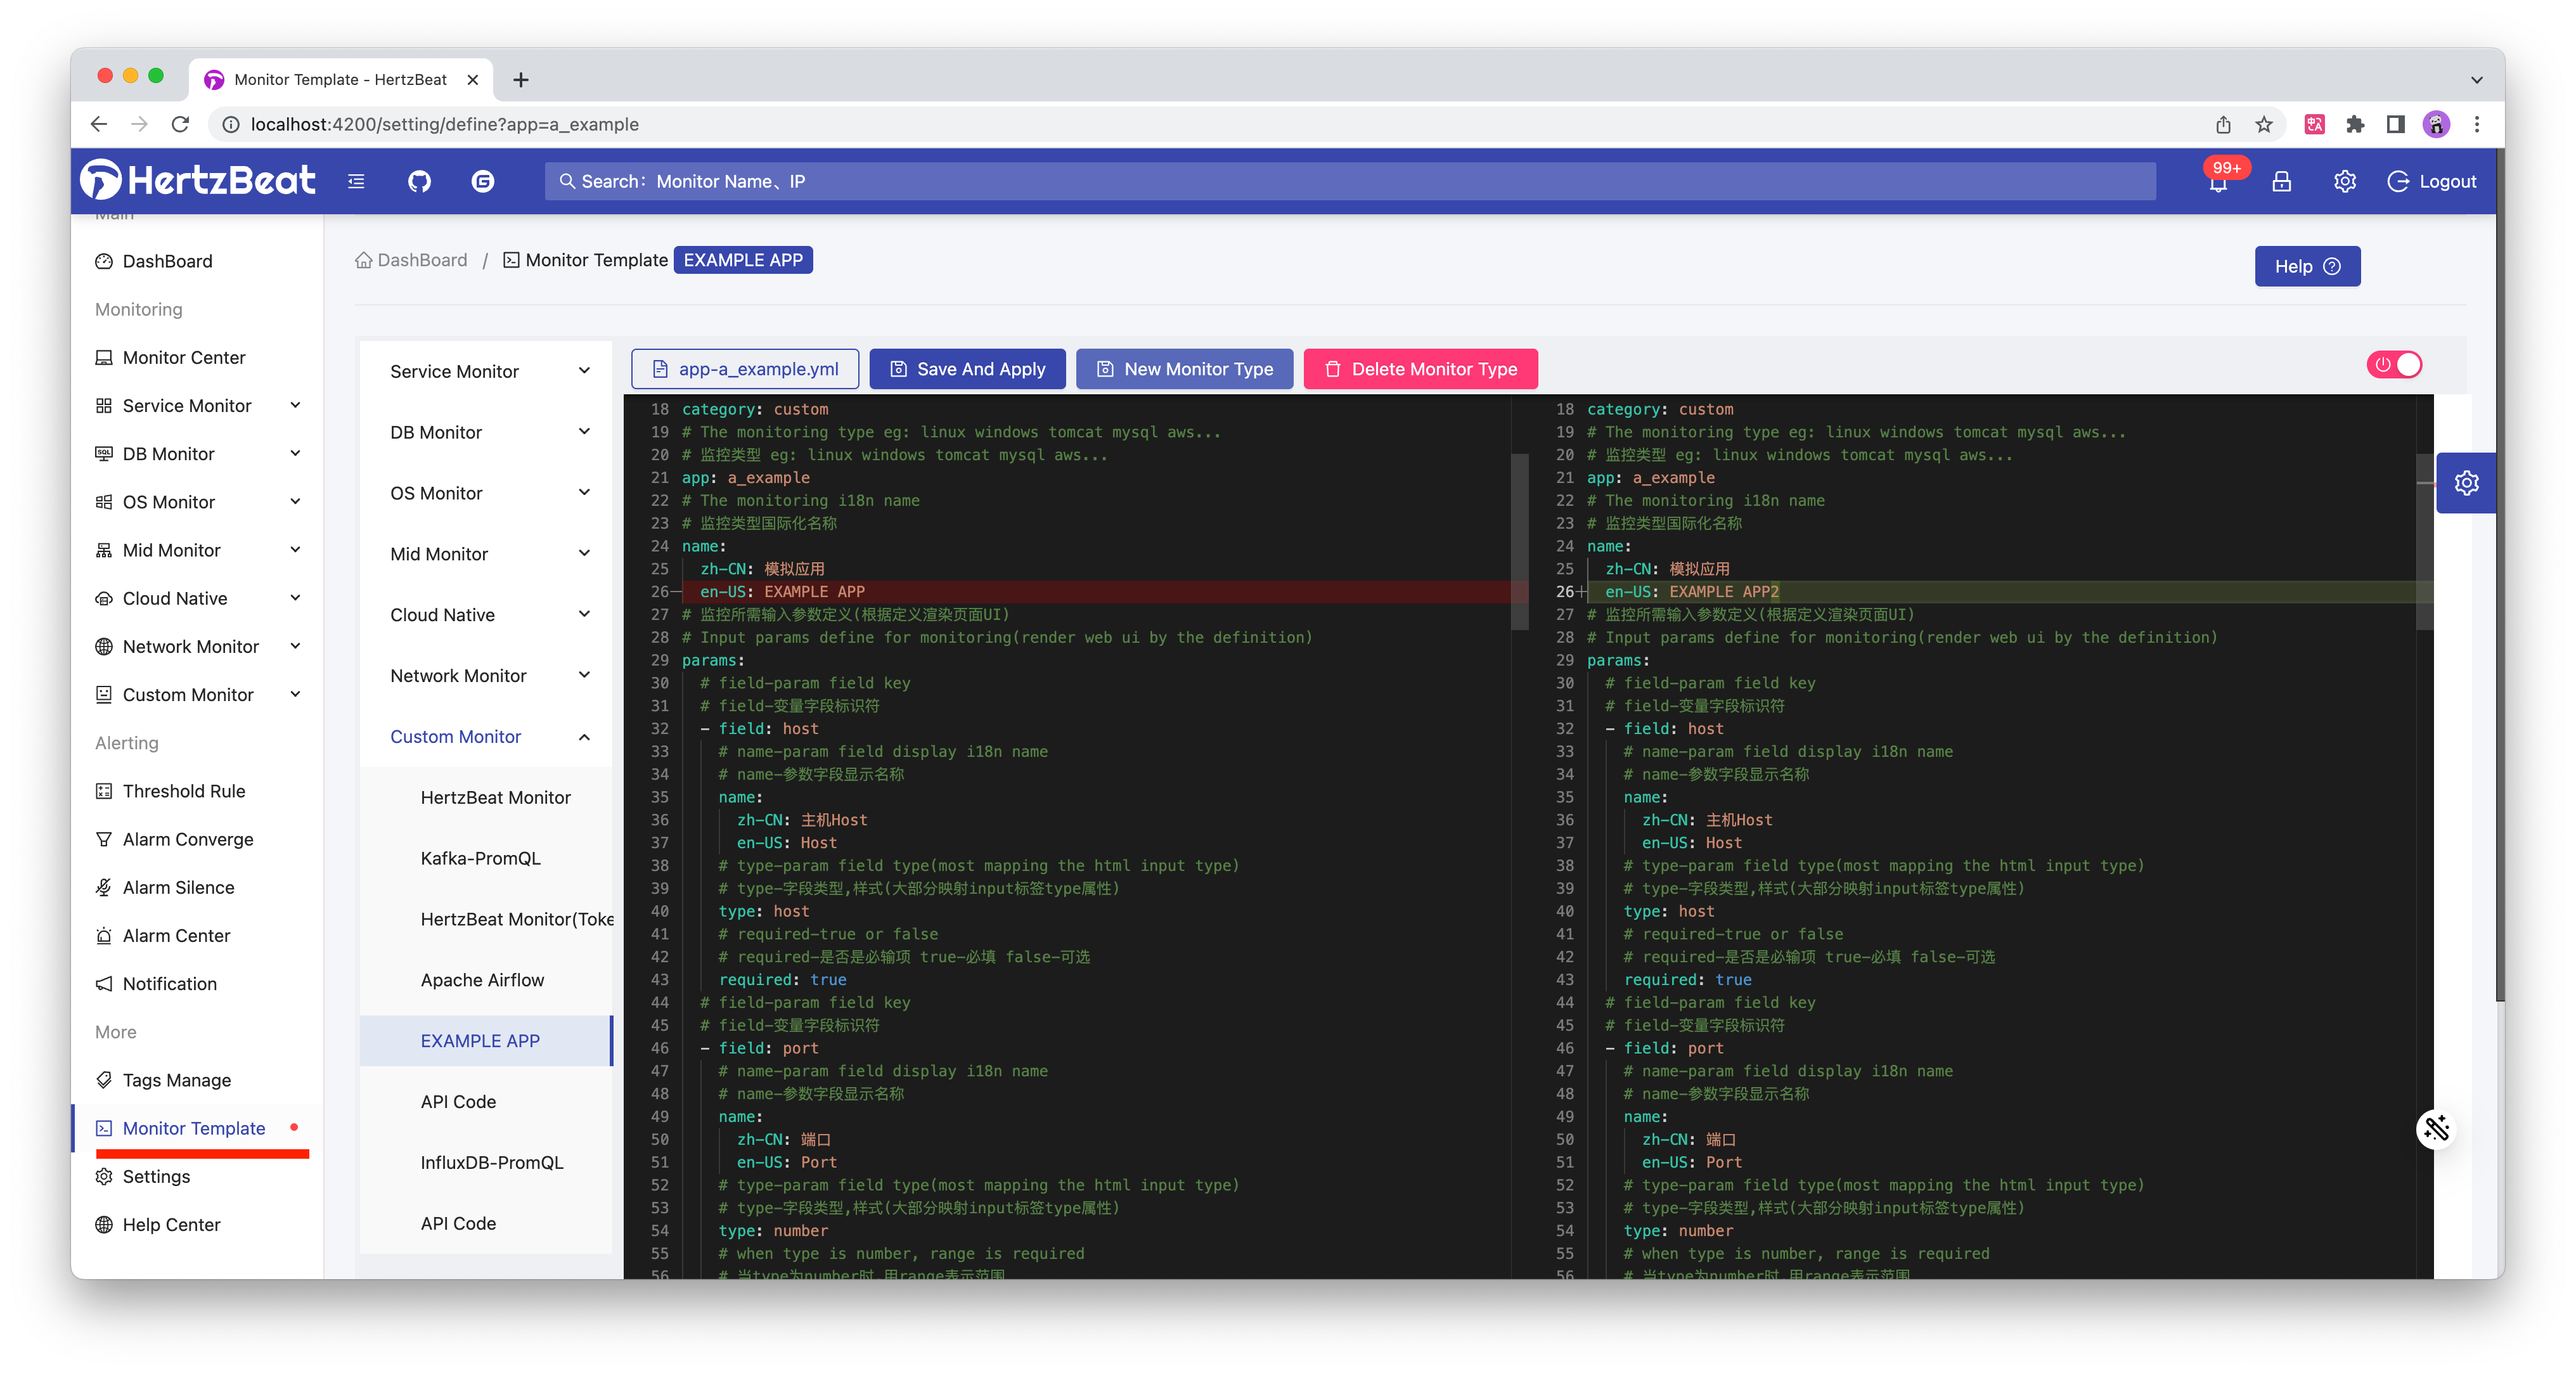
HertzBeat Page -> Monitoring Template Menu -> Add Monitoring Type -> Configure Custom Monitoring Template YML -> Click Save Application -> Use the New Monitoring Type to Add Monitoring

Configuration usages of the monitoring templates yml are detailed below.
Monitoring Template YML
We define all monitoring collection types (mysql,jvm,k8s) as yml monitoring templates, and users can import these templates to support corresponding types of monitoring.
Monitoring template is used to define the name of monitoring type(international), request parameter mapping, index information, collection protocol configuration information, etc.
eg: Customize a monitoring type named example_ngql, which collects metric data using NGQL.
# Monitoring category: service-application service program-application program db-database custom-custom os-operating system bigdata-big data mid-middleware webserver-web server cache-cache cn-cloud native network-network monitoring, etc.
category: db
# Monitoring application type (consistent with the file name) eg: linux windows tomcat mysql aws...
app: example_ngql
name:
  zh-CN: NGQL Custom Monitoring Application
  en-US: NGQL Custom APP
# Monitoring parameter definition. These are input parameter variables, which can be written in the format of ^_^host^_^ to be replaced by system variable values in the later configuration
# This part is usually not modified
params:
  # field-param field key
  - field: host
    name:
      zh-CN: Target Host
      en-US: Target Host
    type: host
    required: true
  - field: graphPort
    name:
      zh-CN: Graph Port
      en-US: Graph Port
    type: number
    range: '[0,65535]'
    required: true
    defaultValue: 9669
  - field: username
    name:
      zh-CN: Username
      en-US: Username
    type: text
    required: true
  - field: password
    name:
      zh-CN: Password
      en-US: Password
    type: password
    required: true
  - field: spaceName
    name:
      zh-CN: Space Name
      en-US: Space Name
    type: text
    required: false
  - field: timeout
    name:
      zh-CN: Connect Timeout(ms)
      en-US: Connect Timeout(ms)
    type: number
    unit: ms
    range: '[0,100000]'
    required: true
    defaultValue: 6000
# Metric collection configuration list
metrics:
  - name: base_info
    i18n:
      zh-CN: Vertex statistics
      en-US: Vertex statistics
    priority: 0
    fields:
      - field: tag1
        type: 1
        i18n:
          zh-CN: tag1
          en-US: tag1
      - field: tag1
        type: 1
        i18n:
          zh-CN: tag2
          en-US: tag2
    aliasFields:
      - tag1
      - tag2
    protocol: ngql
    ngql:
      host: ^_^host^_^
      username: ^_^username^_^
      password: ^_^password^_^
      port: ^_^graphPort^_^
      spaceName: ^_^spaceName^_^
      parseType: columns
      # Define the query statements used to collect data
      commands:
        - match (v:tag1) return "tag1" as name ,count(v) as cnt
        - match (v:tag2) return "tag2" as name ,count(v) as cnt
      timeout: ^_^timeout^_^