HertzBeat's Monitoring Practice for API Gateway Apache ShenYu
Monitoring practice for API gateway Apache ShenYu using HertzBeat, 5 minutes
Introduction to Apache ShenYu
Apache ShenYu is an asynchronous, high-performance, cross-language, responsive API gateway.
- Proxy: supports Apache Dubbo, Spring Cloud, gRPC, Motan, SOFA, TARS, WebSocket, MQTT.
- Security: Signature, OAuth 2.0, JSON Web Token, WAF Plugin
- API Governance: Request, Response, Parameter Mapping, Hystrix, RateLimiter Plugin
- Observability: tracing, metrics, logging plug-ins
- Dashboard: dynamic flow control, visual backend for user menu permissions
- Extension: plugin hot-plugging, dynamic loading
- Clustering: NGINX, Docker, Kubernetes
- Languages: .NET, Python, Go, Java clients available for API registration
HertzBeat Introduction
HertzBeat is an open source, easy to use and friendly real-time monitoring tool, no Agent, with powerful custom monitoring capabilities. Support for application services, database, operating system, middleware, cloud native monitoring, threshold alarms, alarm notification (email WeChat Nail Flybook). HertzBeat's powerful customization, multi-type support, easy to extend, low-coupling, hope to help developers and small and medium-sized teams to quickly build their own monitoring system.
Monitor Apache ShenYu in HertzBeat in 5 minutes
You must have a ShenYu environment and a HertzBeat environment
- ShenYu Deployment and Installation Documentation
- HertzBeat Deployment and Installation Documentation
i. Enable the metrics plugin on the ShenYu side, which will provide the metrics interface data
The plugin is the core implementer of the Apache ShenYu gateway, and metrics data collection is also integrated at
ShenYuin the form of a plugin -Metrics Plugin. TheMetrics pluginis used by the gateway to monitor its own operational status (JVMrelated), request responses and other related metrics.
-
Add the
metrics plugindependency to thepom.xmlfile of the gateway.`<dependency>`
`<groupId>`org.apache.shenyu`</groupId>`
`<artifactId>`shenyu-spring-boot-starter-plugin-metrics`</artifactId>`
`<version>`${project.version}`</version>`
`</dependency>` -
metricplugin Capture is turned off by default, edit the following in the gateway's configurationyamlfile:shenyu:
metrics:
enabled: true #Set to true to enable
name: prometheus
host: 127.0.0.1 #exposed ip
port: 8090 #Exposed port
jmxConfig: #jmx configuration
props: #jvm_enabled: true
jvm_enabled: true #Enable monitoring metrics for jvm -
Restart ShenYu Gateway, open a browser or use curl to access
http://ip:8090, you can see the metric data.
ii. Adding ShenYu Monitor in HertzBeat Monitor Page
-
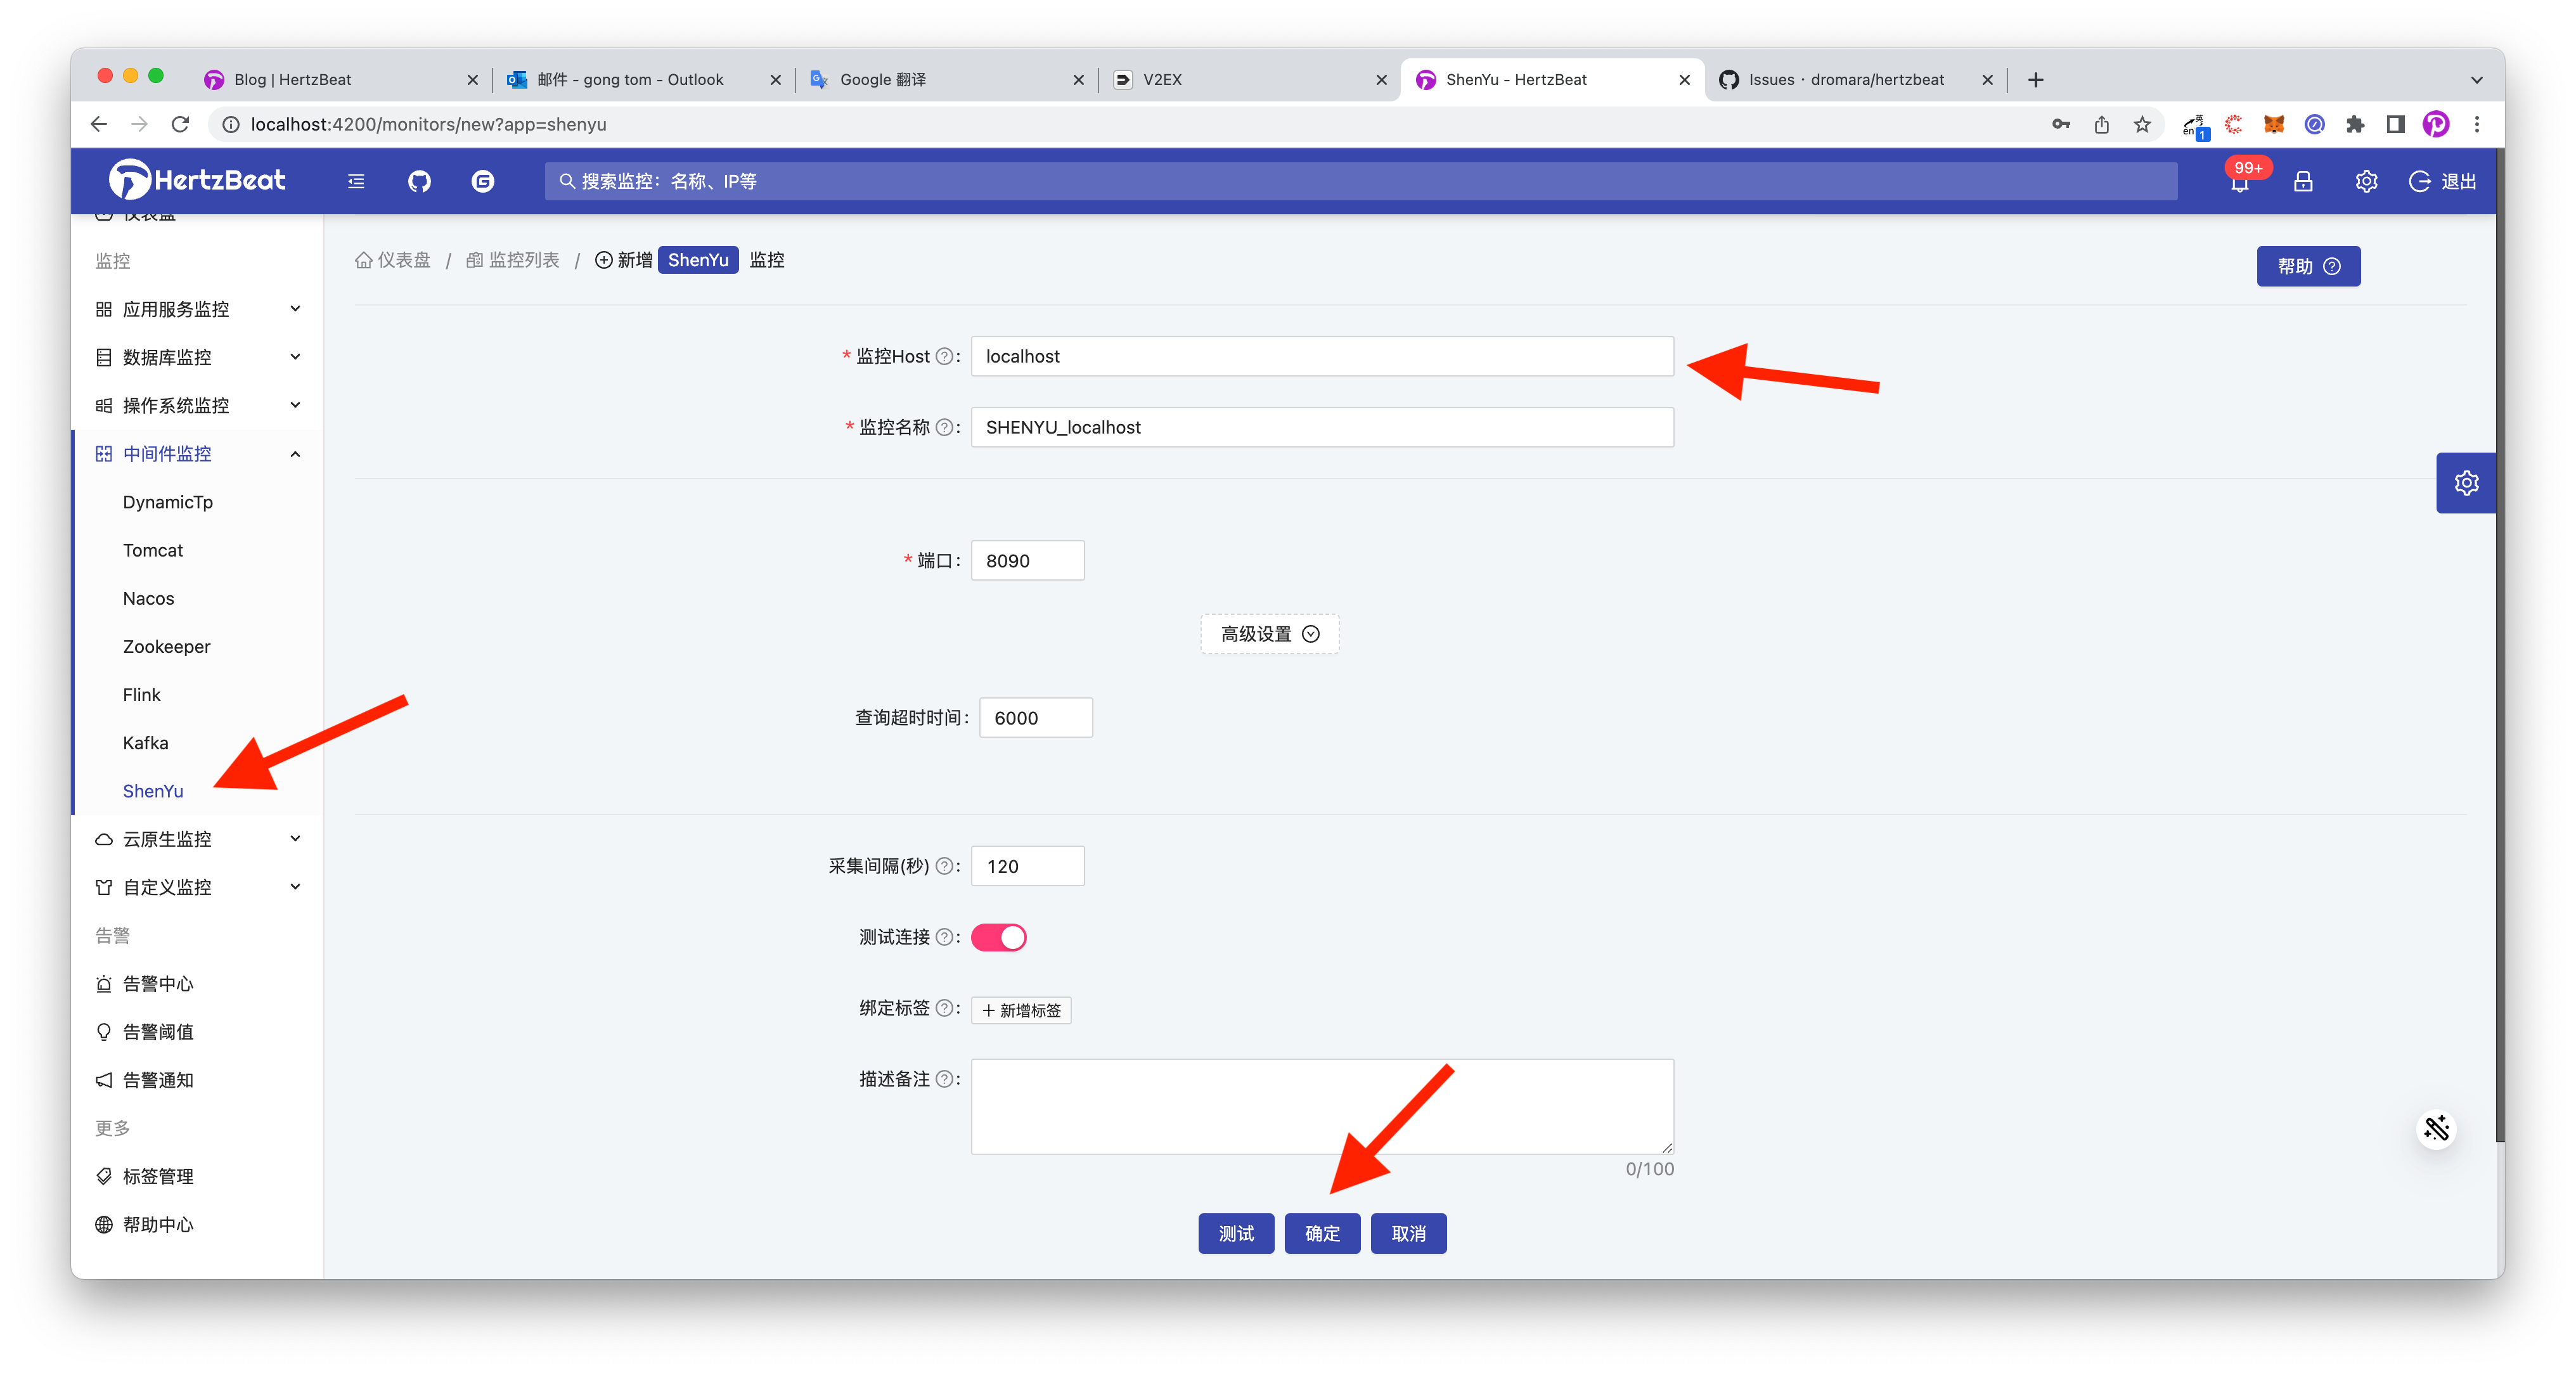
Click Add ShenYu Monitor
Path: Menu -> Middleware Monitor -> ShenYu Monitor -> Add ShenYu Monitor
-
Configure the parameters required for monitoring ShenYu
On the monitor page, fill in ShenYu service IP, monitor port (default 8090), and click OK to add. For other parameters such as collection interval, timeout, etc., you can refer to the help file https://hertzbeat.apache.org/docs/help/shenyu/

-
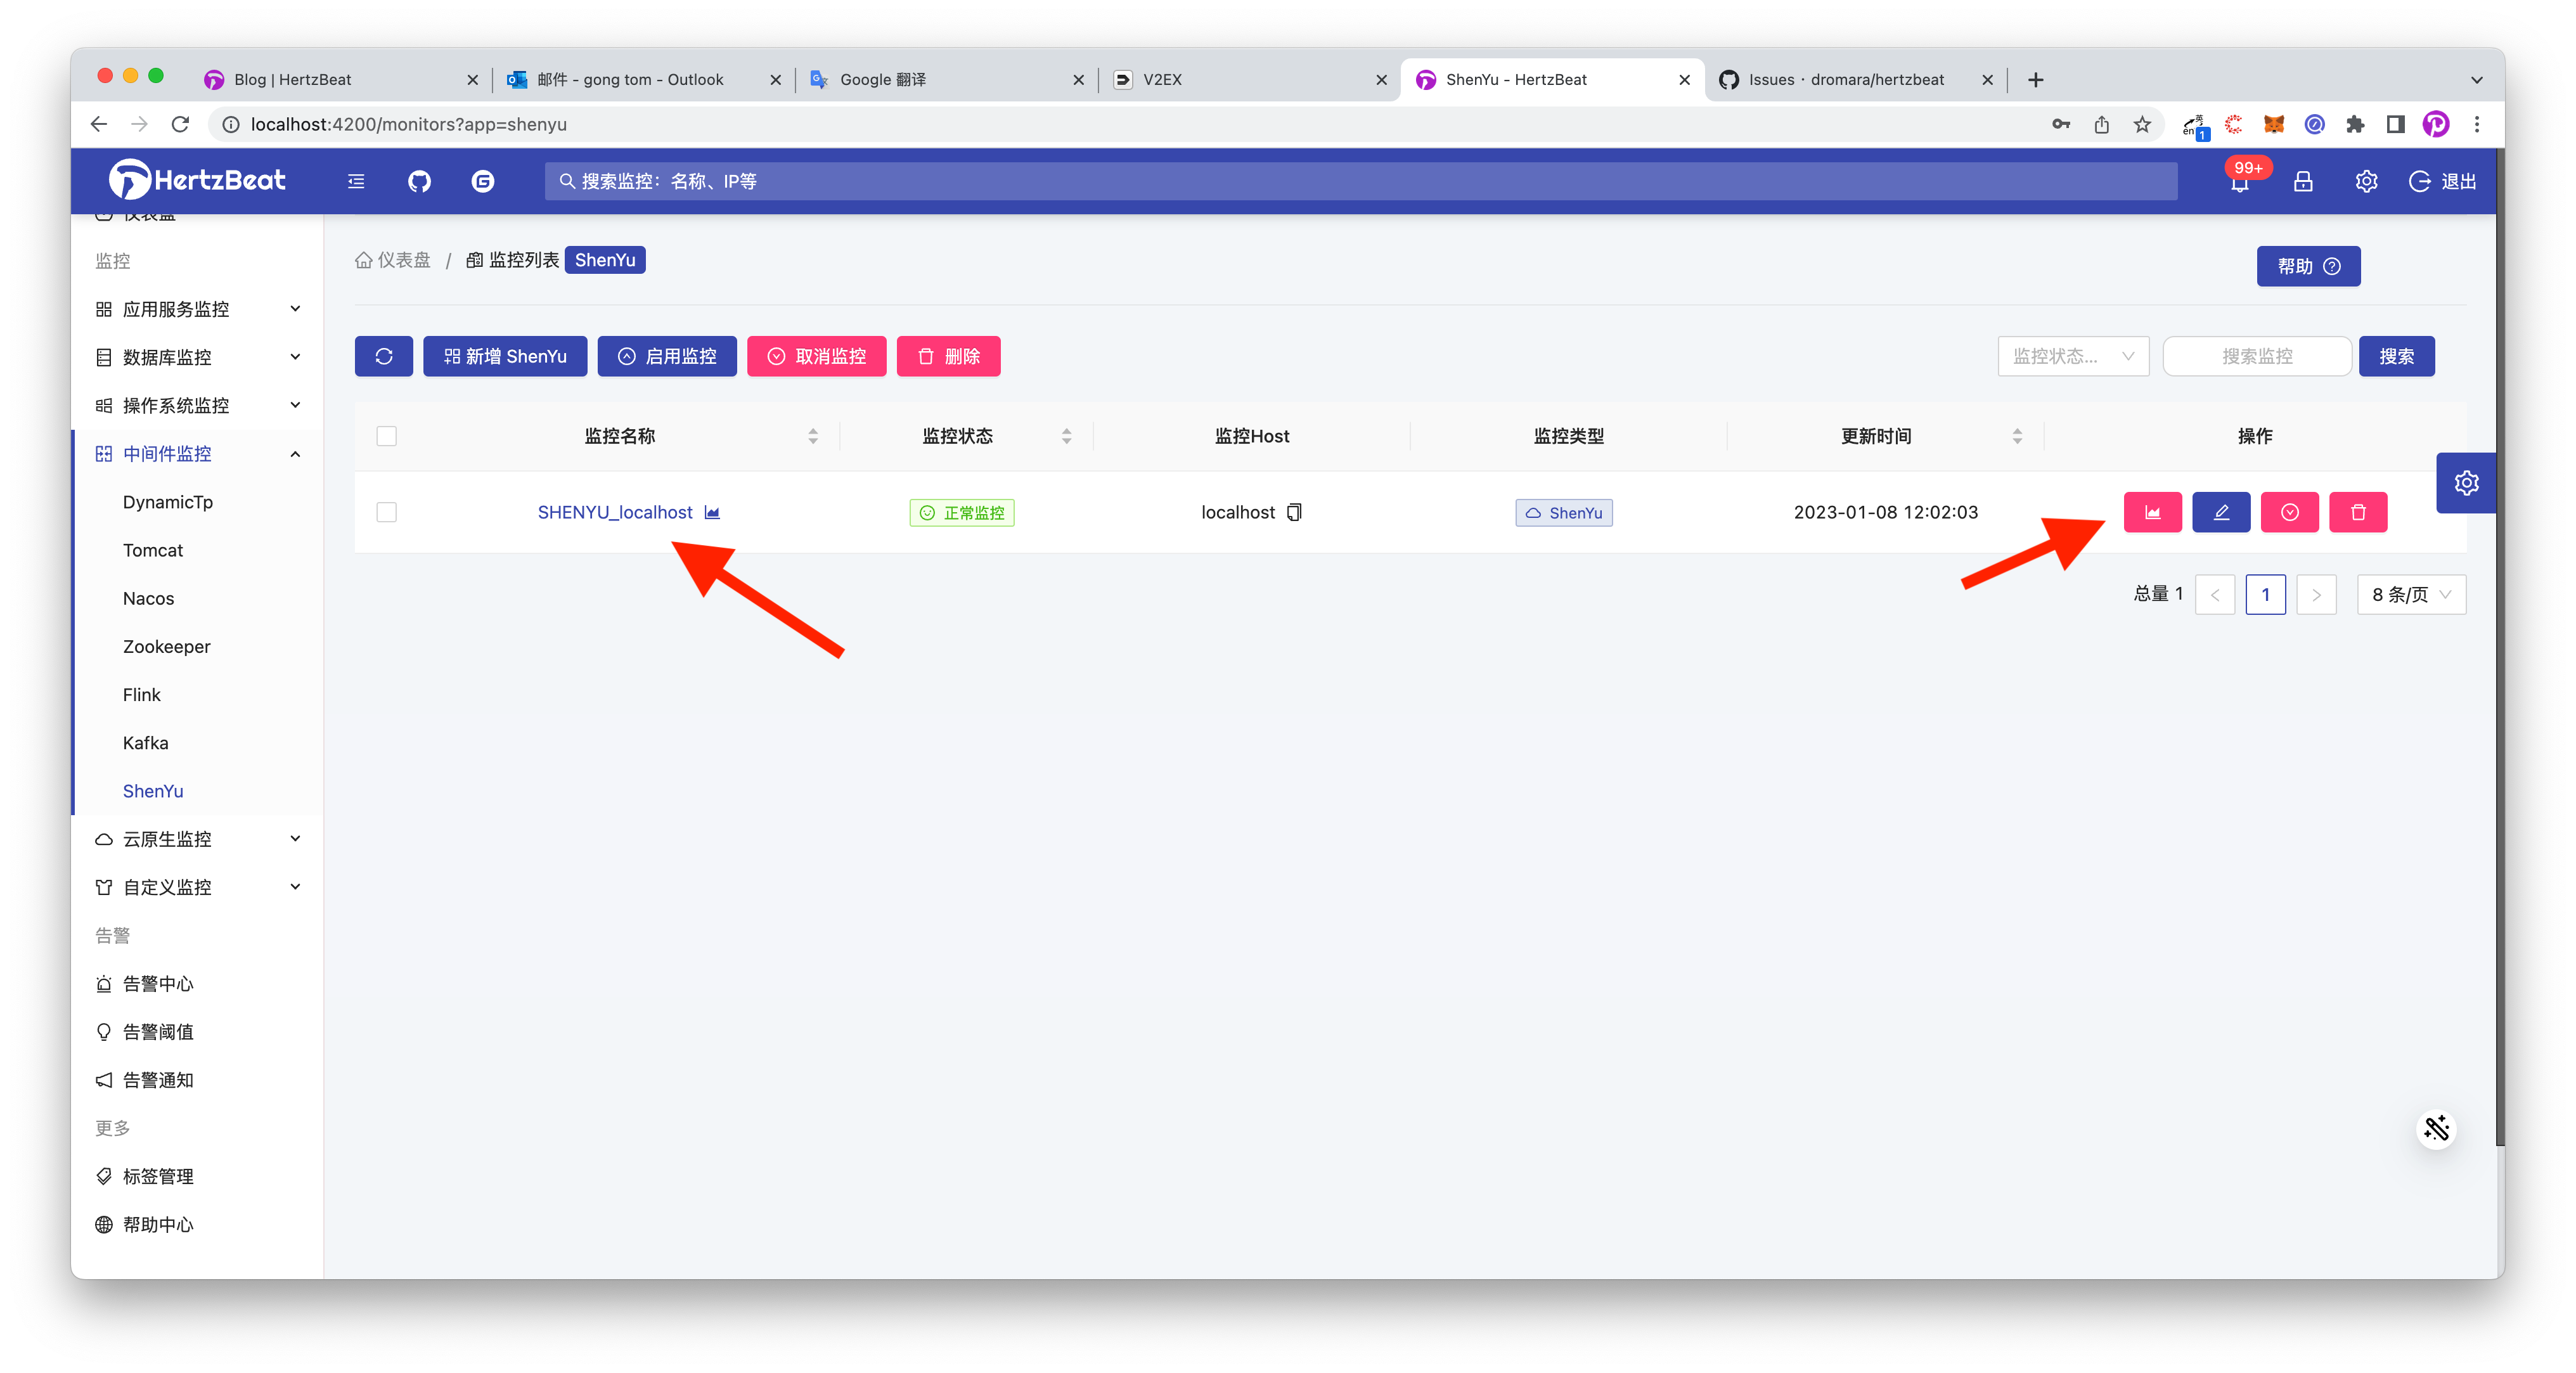
Done ✅, now we have added monitoring for ShenYu, check the monitor list to see our additions.
-
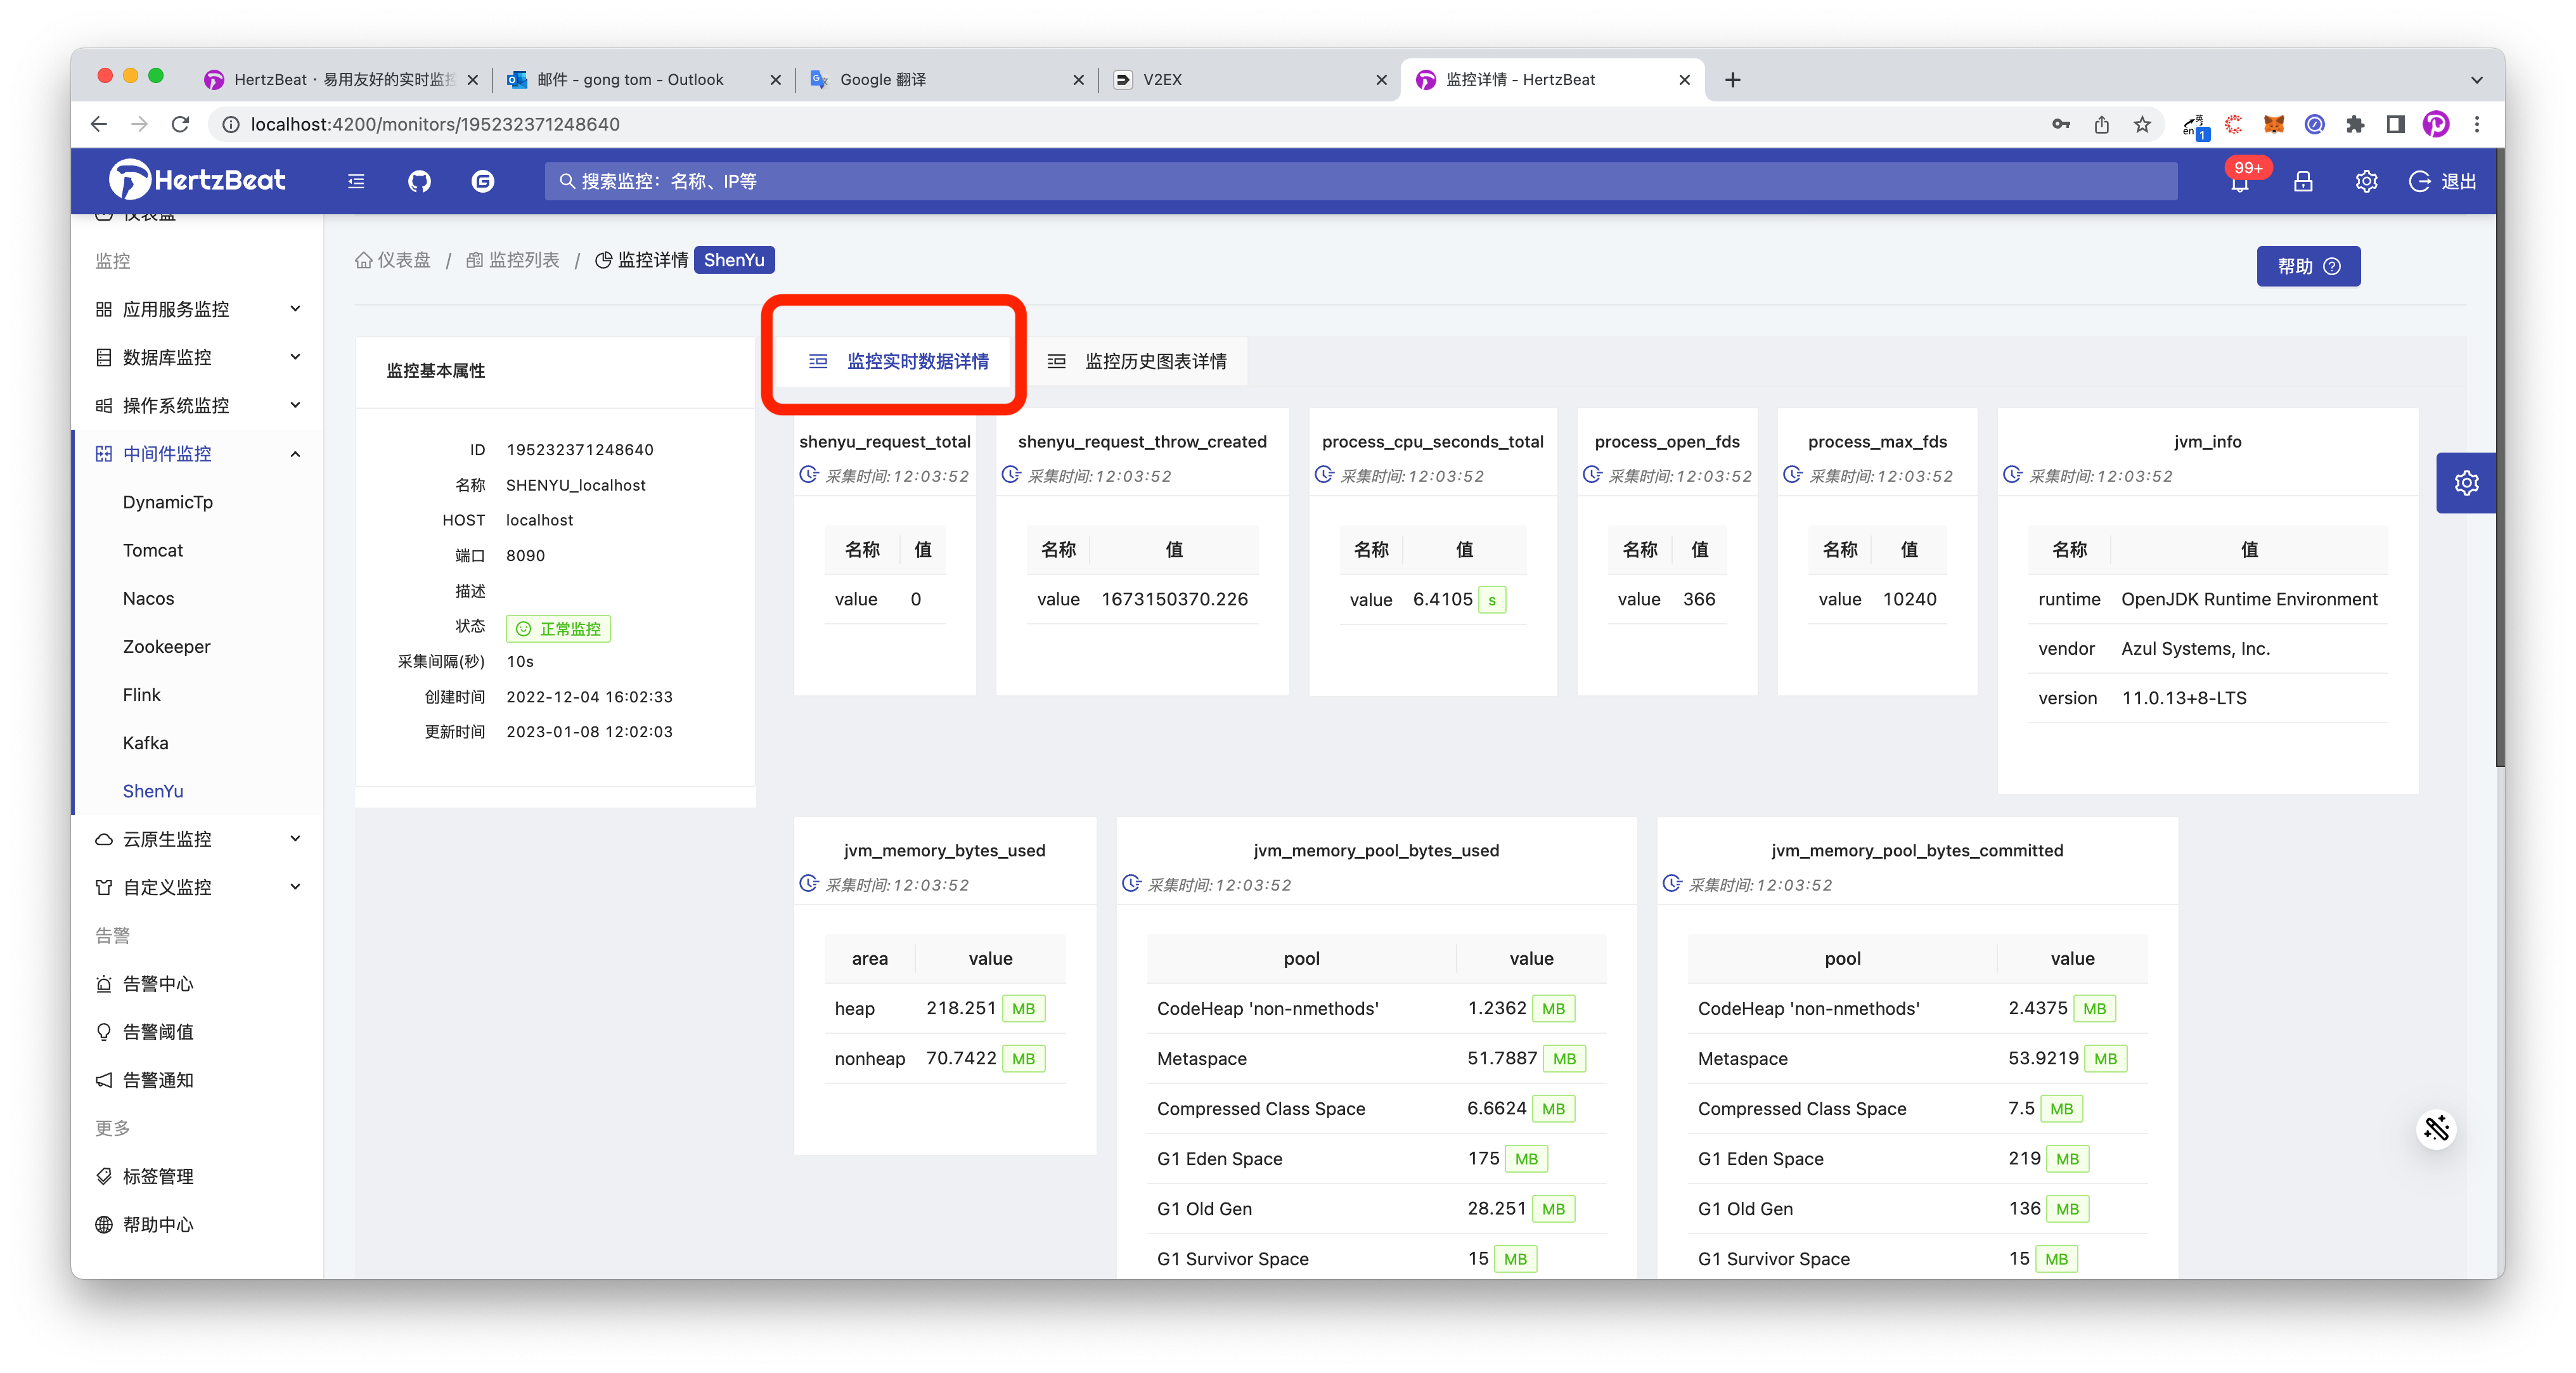
Click Options->Monitoring Details icon in the monitor list to view ShenYu's real-time monitoring metrics.
-
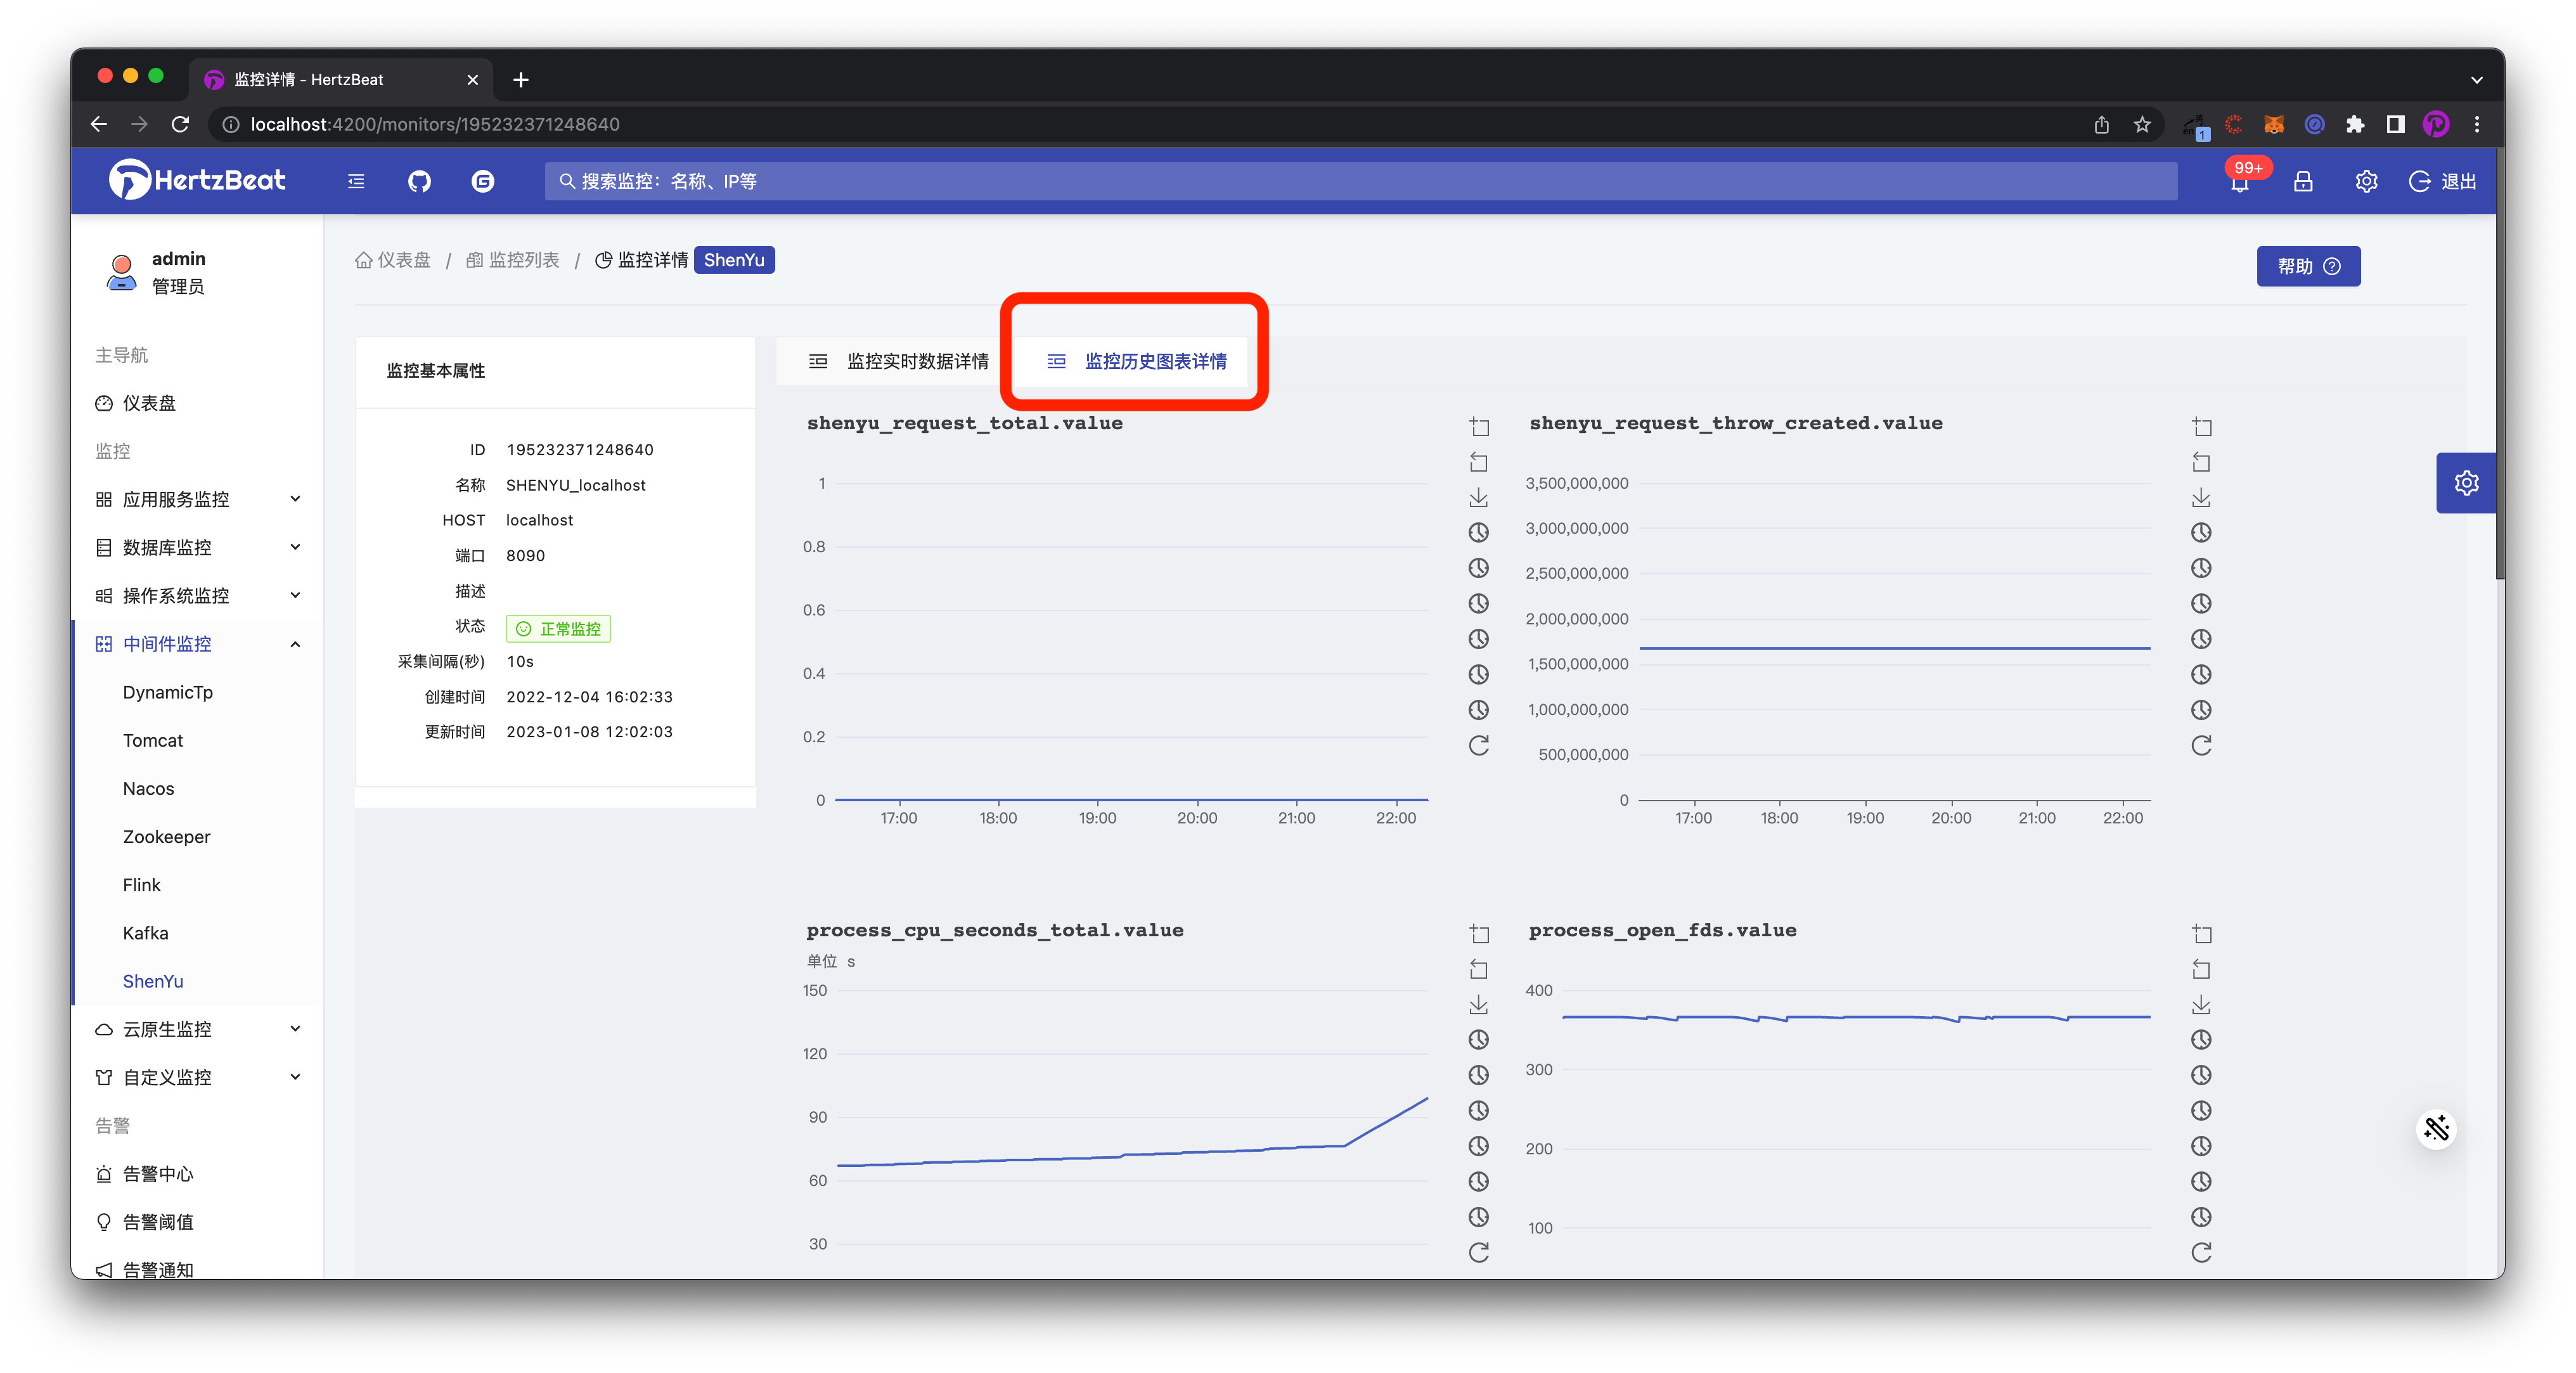
Click the Monitor History TAB to view ShenYu's historical monitoring metrics graphs 📈.
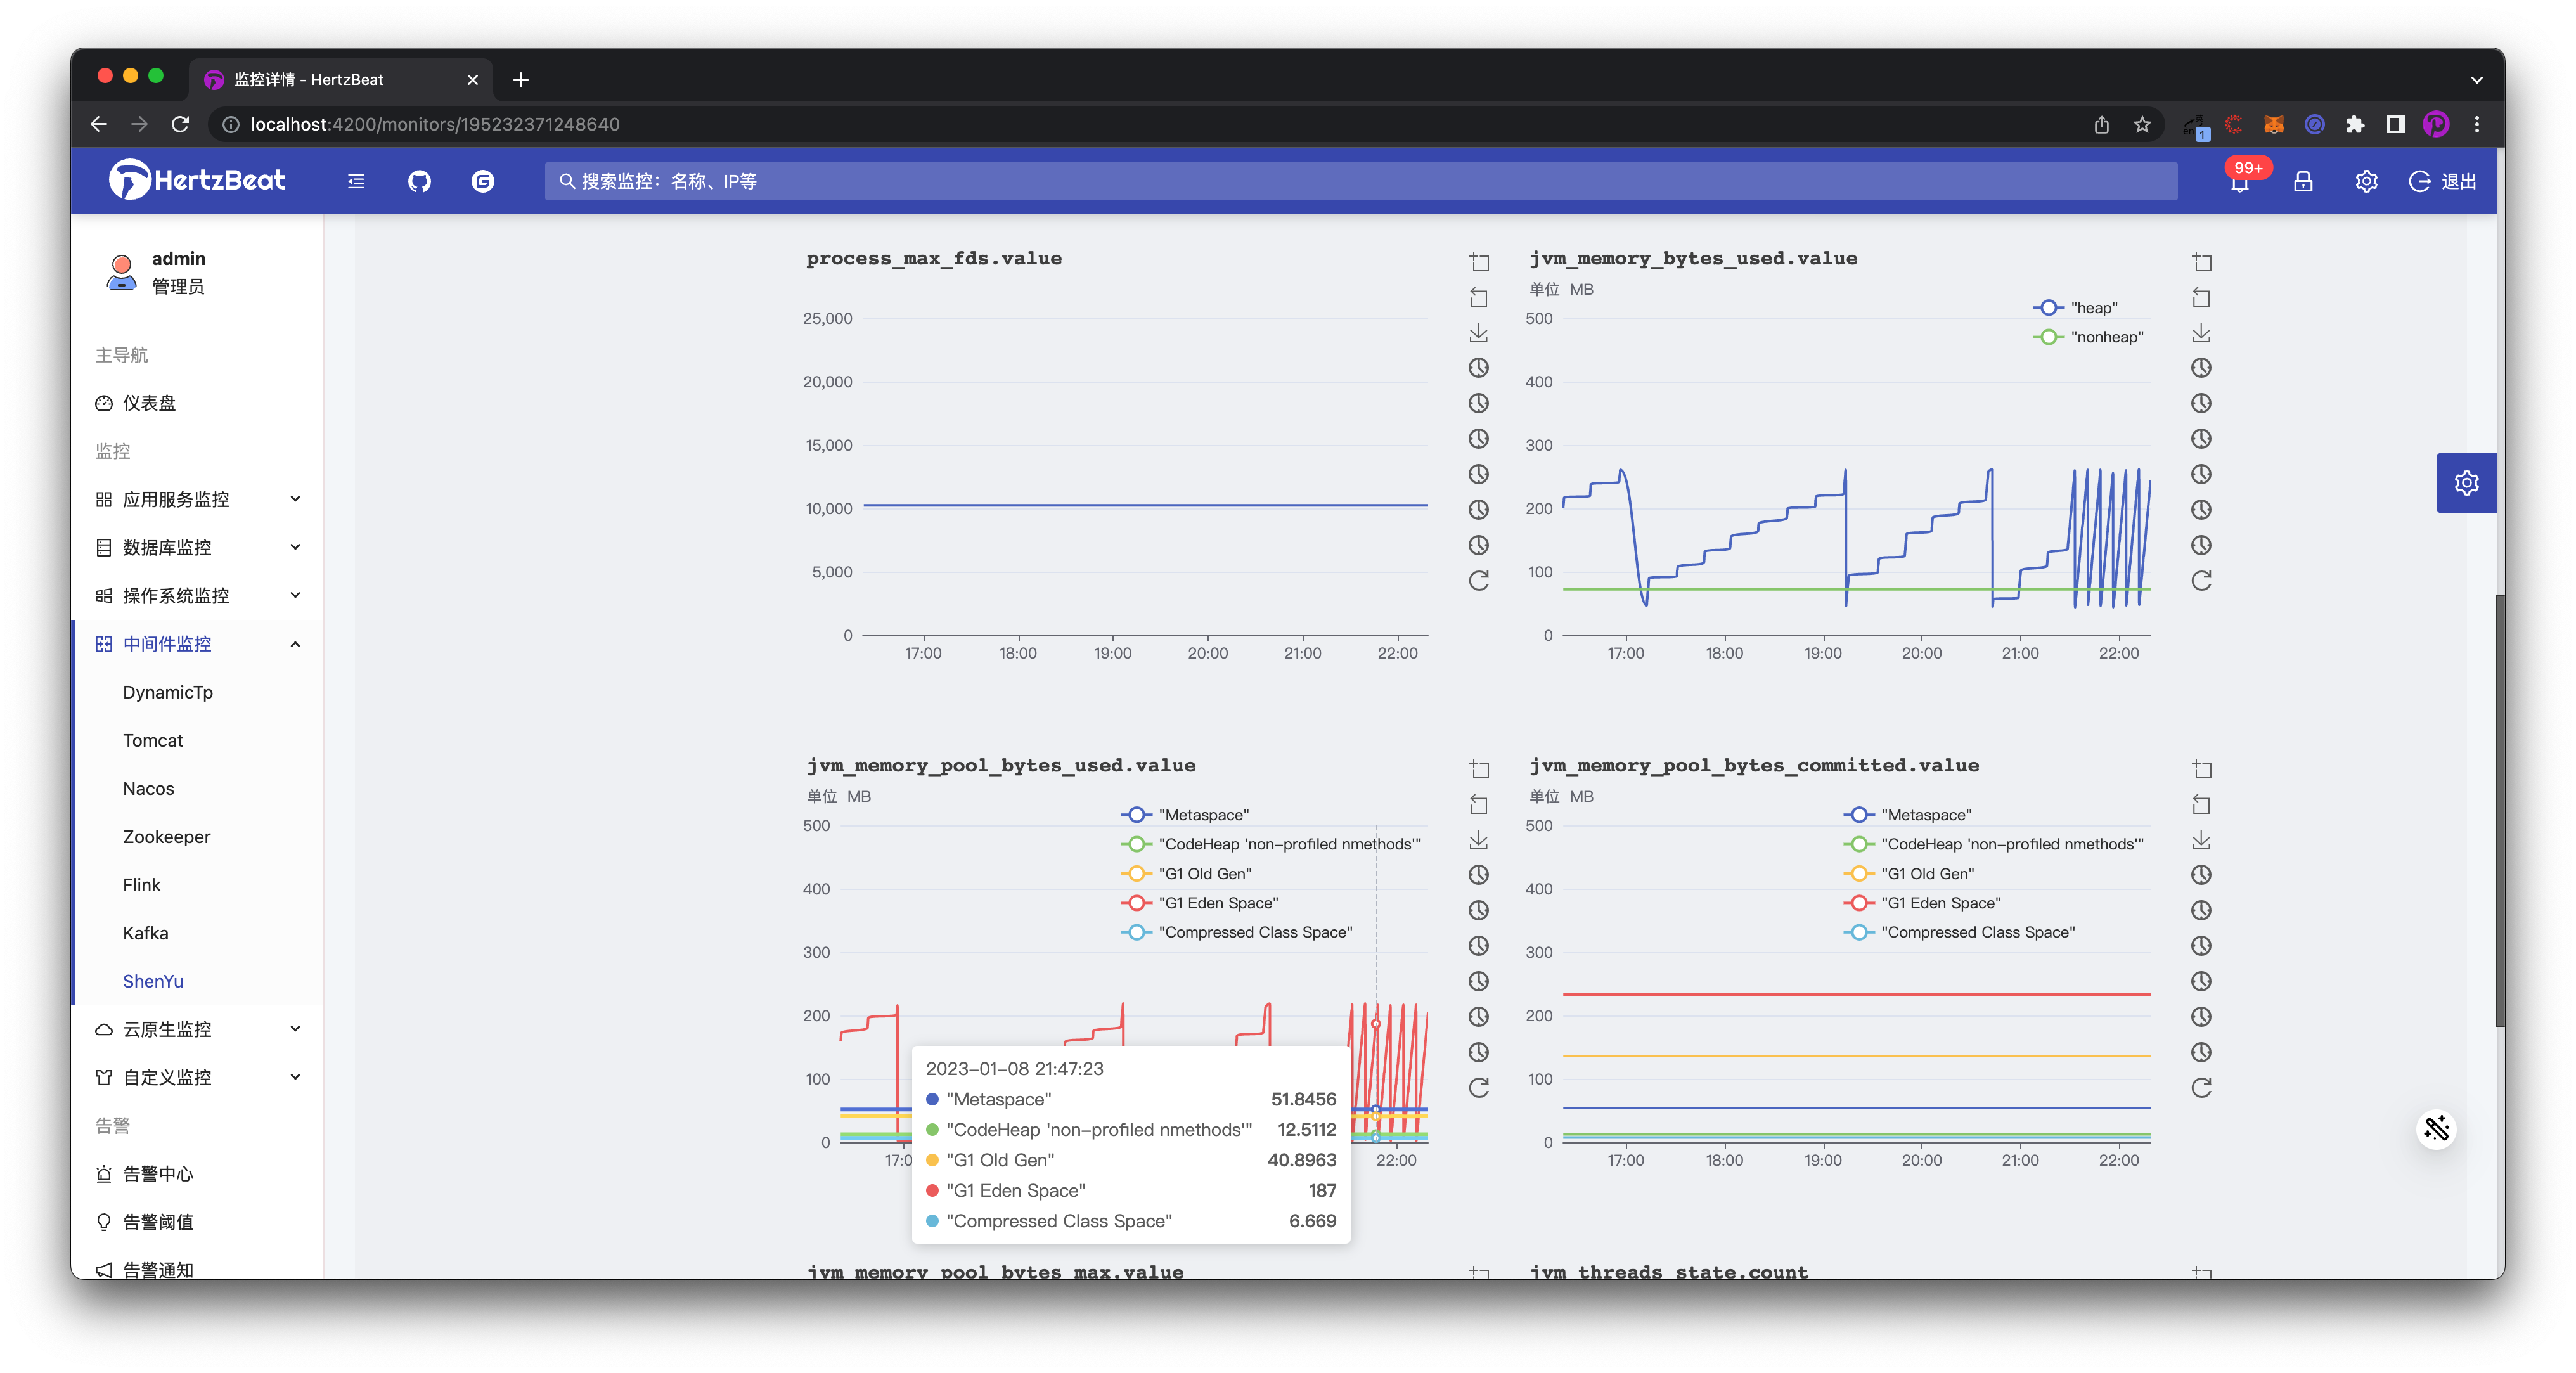
DONE! With the above steps, it's really only two steps
- The first step is to enable the
metricsplugin on the ShenYu side. - **The second step is to configure the IP ports on the HertzBeat monitoring page to add monitoring
By the above two steps we have finished monitoring Apache ShenYu, we can check the monitoring details and metrics information in HertzBeat anytime to observe its service status. Of course, just looking at it is not perfect, monitoring is often accompanied by alarm thresholds, when some of ShenYu's indicators exceed our expectations or abnormalities, we can promptly notify the person in charge of our counterparts, the person in charge of the notification to deal with the problem, so that is a complete monitoring and alerting process.
Next we will demonstrate step by step how to configure the threshold alarm notification in HertzBeat system, so that when ShenYu's metrics are abnormal, we will be notified in a timely manner **This is a complete monitoring and alerting process.
III. Adding ShenYu Metrics Threshold Alerts to the HertzBeat System
-
Configure an alarm threshold for an important metric.
Path: Menu -> Alert Thresholds -> Add Thresholds
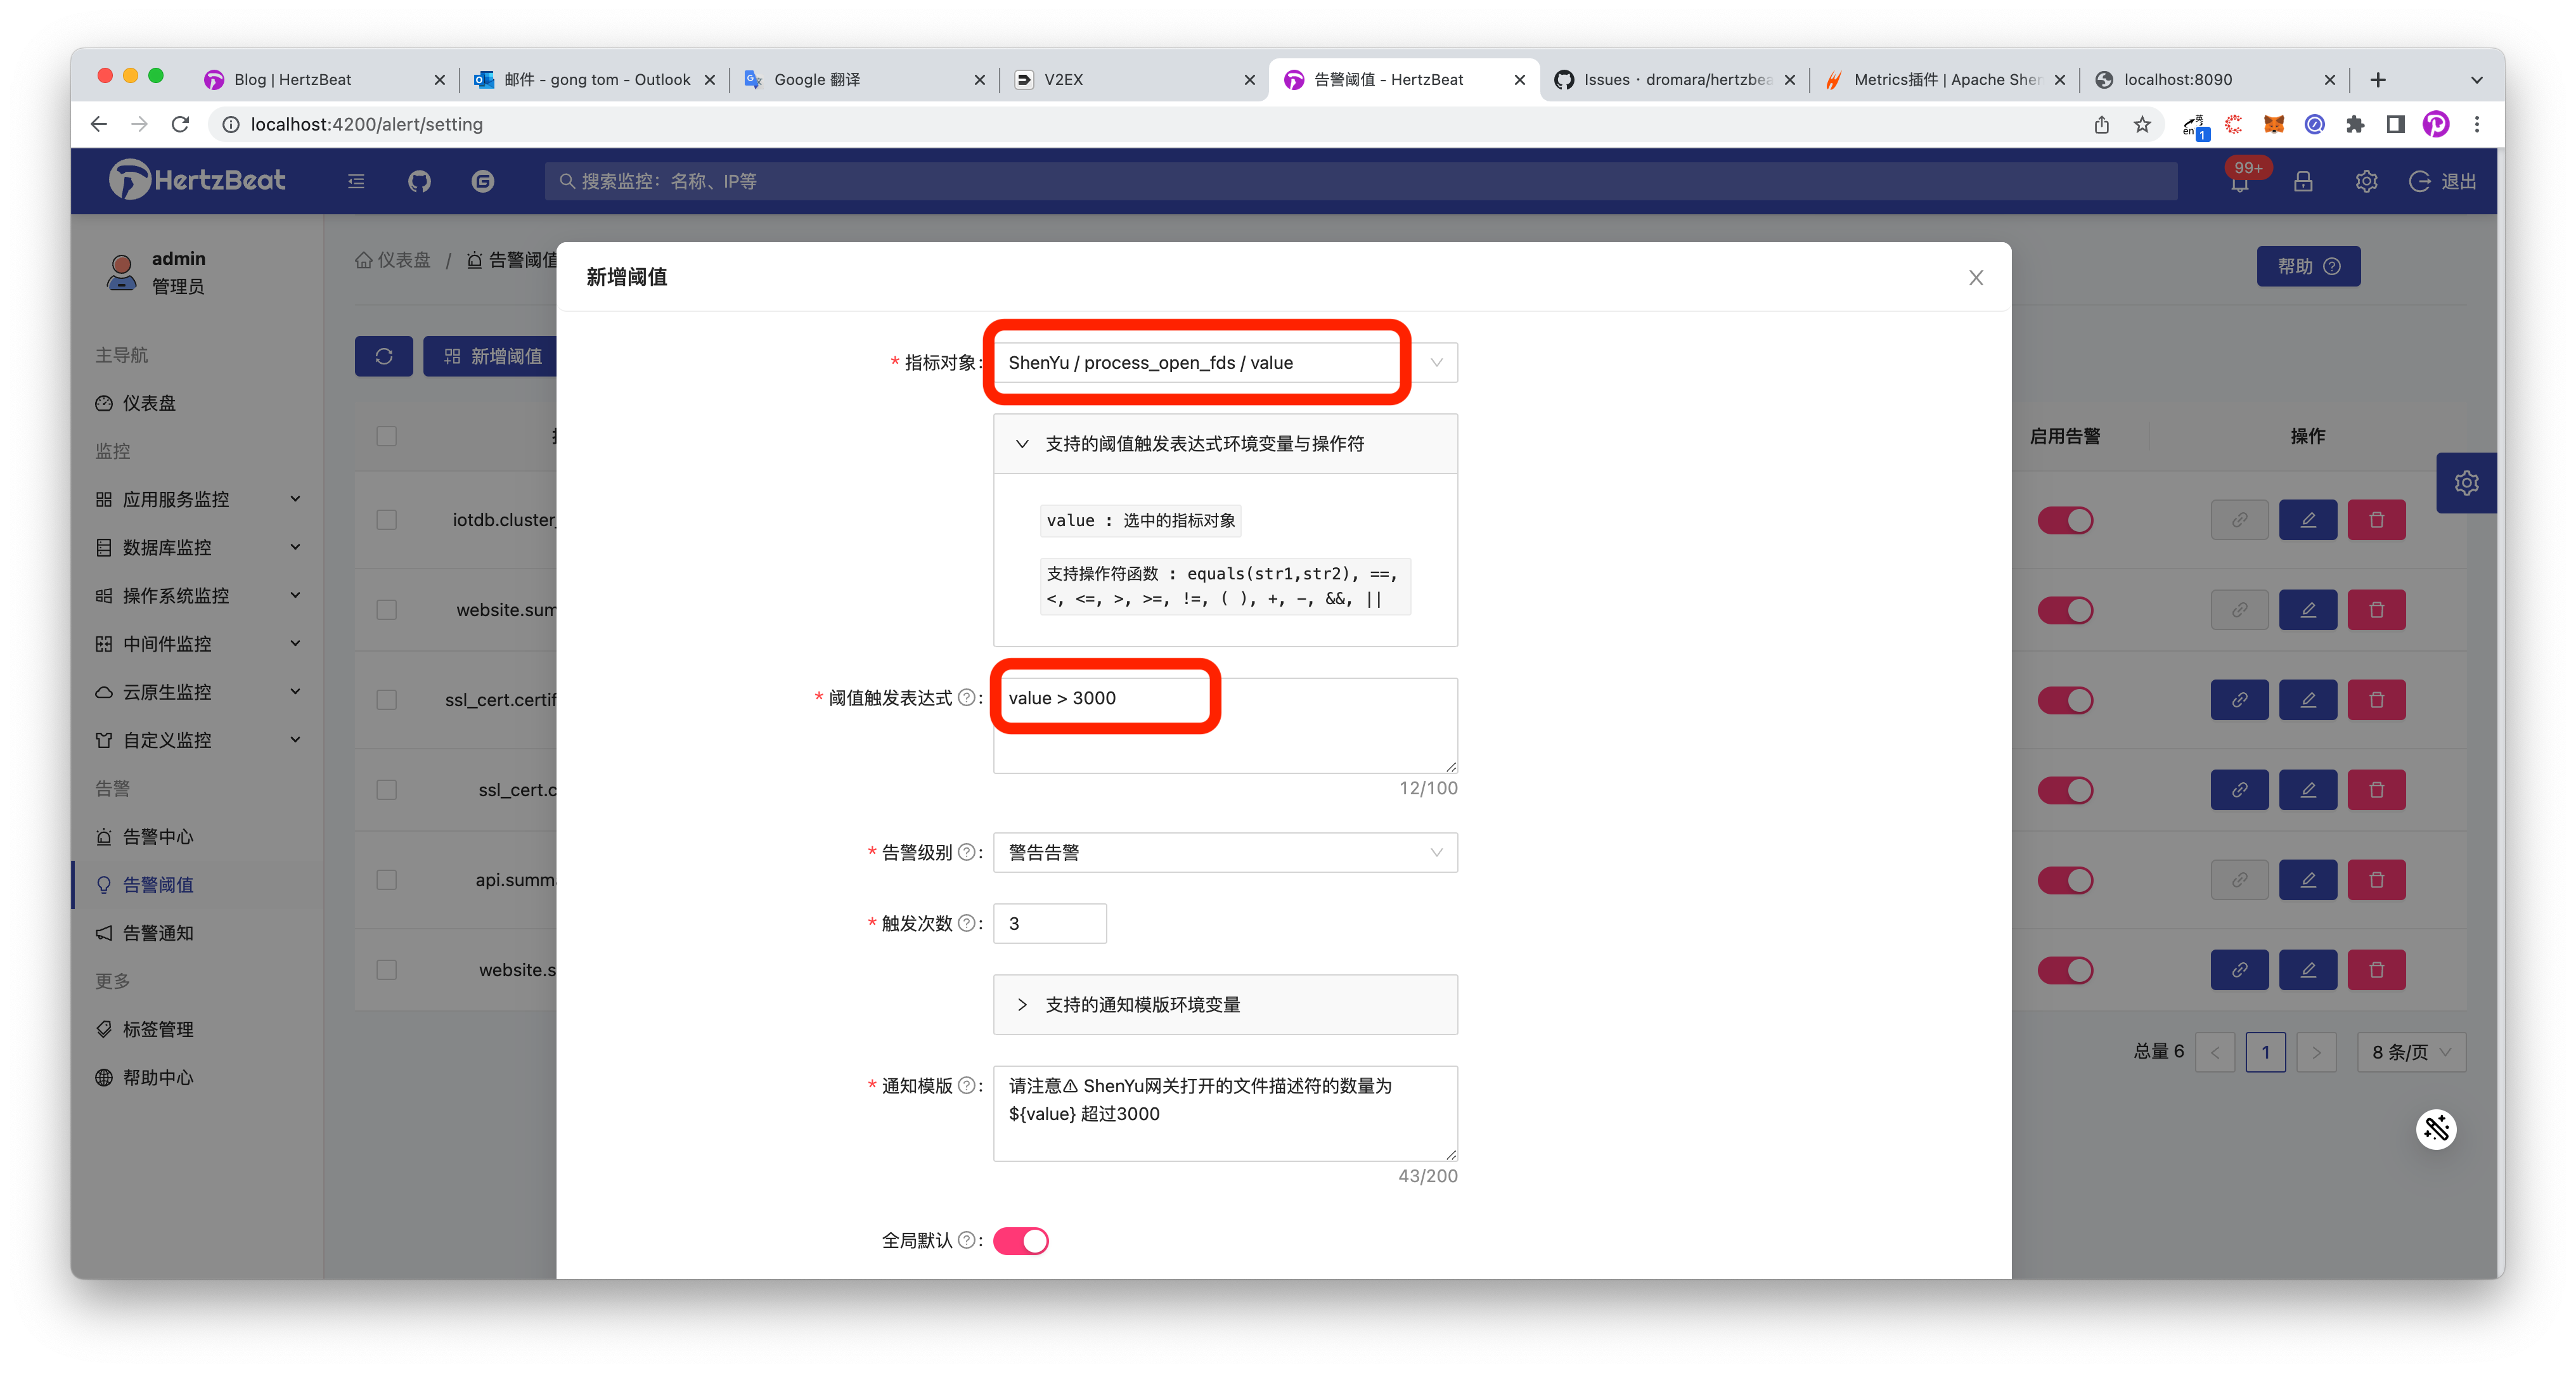
- There are a lot of metrics in ShenYu monitoring, for example, we will set the threshold for the
number of open file descriptorsprocess_open_fds->valuemetric, which will alert you when the number of open file descriptors on the server side is greater than 3,000. - Here we configure an alert to be issued when the
value' ofprocess_open_fds` exceeds 3000, with an alert level of Warning alert, which is triggered three times, as shown in the following figure.
- There are a lot of metrics in ShenYu monitoring, for example, we will set the threshold for the
-
Add message notification recipients
Configure recipients to let alert message know who to send to and in what way.
Path: Menu -> Alert Notification -> Alert Recipients -> Add New Recipient.
Message notification methods support Email, Nail, WeChat, Flybook, WebHook, SMS, etc. Here we take the commonly used Nail as an example.
- Refer to this help document https://hertzbeat.apache.org/docs/help/alert_dingtalk Configure the bot on the pinning side, set the security customization keyword
HertzBeat, get the correspondingaccess_tokenvalue. - Configure the recipient parameters in HertzBeat as follows.
[Alert Notification] -> [Add Recipient] -> [Select Nailed Bot Notification Method] -> [Set Nailed Bot ACCESS_TOKEN] -> [OK]

- Refer to this help document https://hertzbeat.apache.org/docs/help/alert_dingtalk Configure the bot on the pinning side, set the security customization keyword
-
Configure the associated alert notification policy ⚠️ [Add Notification Policy] -> [Associate the recipient you just set] -> [OK] !
Configure the alert notification policy to bind alert messages to recipients so that you can decide which alerts go to which person.

Over and out, now wait for the alert message to come through. Ding, ding, ding, ding
[HertzBeat Alert Notification]
Alert target object : shenyu.process_open_fds.value
Task ID : 205540620349696
Task name : SHENYU_localhost
Alarm level : Warning alarm
Alarm Trigger Time : 2023-01-08 22:17:06
Details : Please note that the number of file descriptors opened by ⚠️ ShenYu gateway is 3044 more than 3000
Summary
This hands-on article takes us through how to use HertzBeat to monitor Apache ShenYu metrics data, and we can find that HertzBeat, which combines Monitoring-Alert-Notification, is much more convenient to operate and use, and you can include ShenYu in the monitoring by simply clicking on a page. There is no need to deploy multiple components and write multiple YML configuration files.
Apache ShenYu Github: https://github.com/apache/shenyu HertzBeat Github: https://github.com/apache/hertzbeat
Welcome to learn about using Star Support Oh!
Experience heartbeat with a single docker command:
docker run -d -p 1157:1157 --name hertzbeat apache/hertzbeat