Monitoring Linux Operating Systems Using Open Source Real-Time Monitoring HertzBeat
Use the open source real-time monitoring tool HertzBeat to monitor and alarm the Linux operating system, and it will be done in 5 minutes
Introduction to HertzBeat
HertzBeat is an open source, easy-to-use and friendly real-time monitoring tool that does not require Agent and has powerful custom monitoring capabilities.
- Integrate monitoring-alarm-notification, support monitoring of application services, databases, operating systems, middleware, cloud native, etc., threshold alarms, alarm notifications (email WeChat Dingding Feishu SMS Slack Discord Telegram).
- It configurable protocol specifications such as Http, Jmx, Ssh, Snmp, Jdbc, Prometheus, etc. You only need to configure YML to use these protocols to customize and collect any metrics you want to collect. Do you believe that you can immediately adapt to a new monitoring type such as K8s or Docker just by configuring YML?
- HertzBeat's powerful customization, multi-type support, easy expansion, and low coupling, hope to help developers and small and medium teams quickly build their own monitoring tools.
Github: https://github.com/apache/hertzbeat
Get Linux Monitoring Done in HertzBeat in 5 Minutes
Prerequisites, you already have a Linux environment and a HertzBeat environment
Add monitoring of the Linux operating system to the monitoring page of the open source monitoring tool HertzBeat
-
Click Add Linux Monitoring
Path: Menu -> Operating System Monitoring -> Linux Operating System -> Add Linux Operating System Monitoring

-
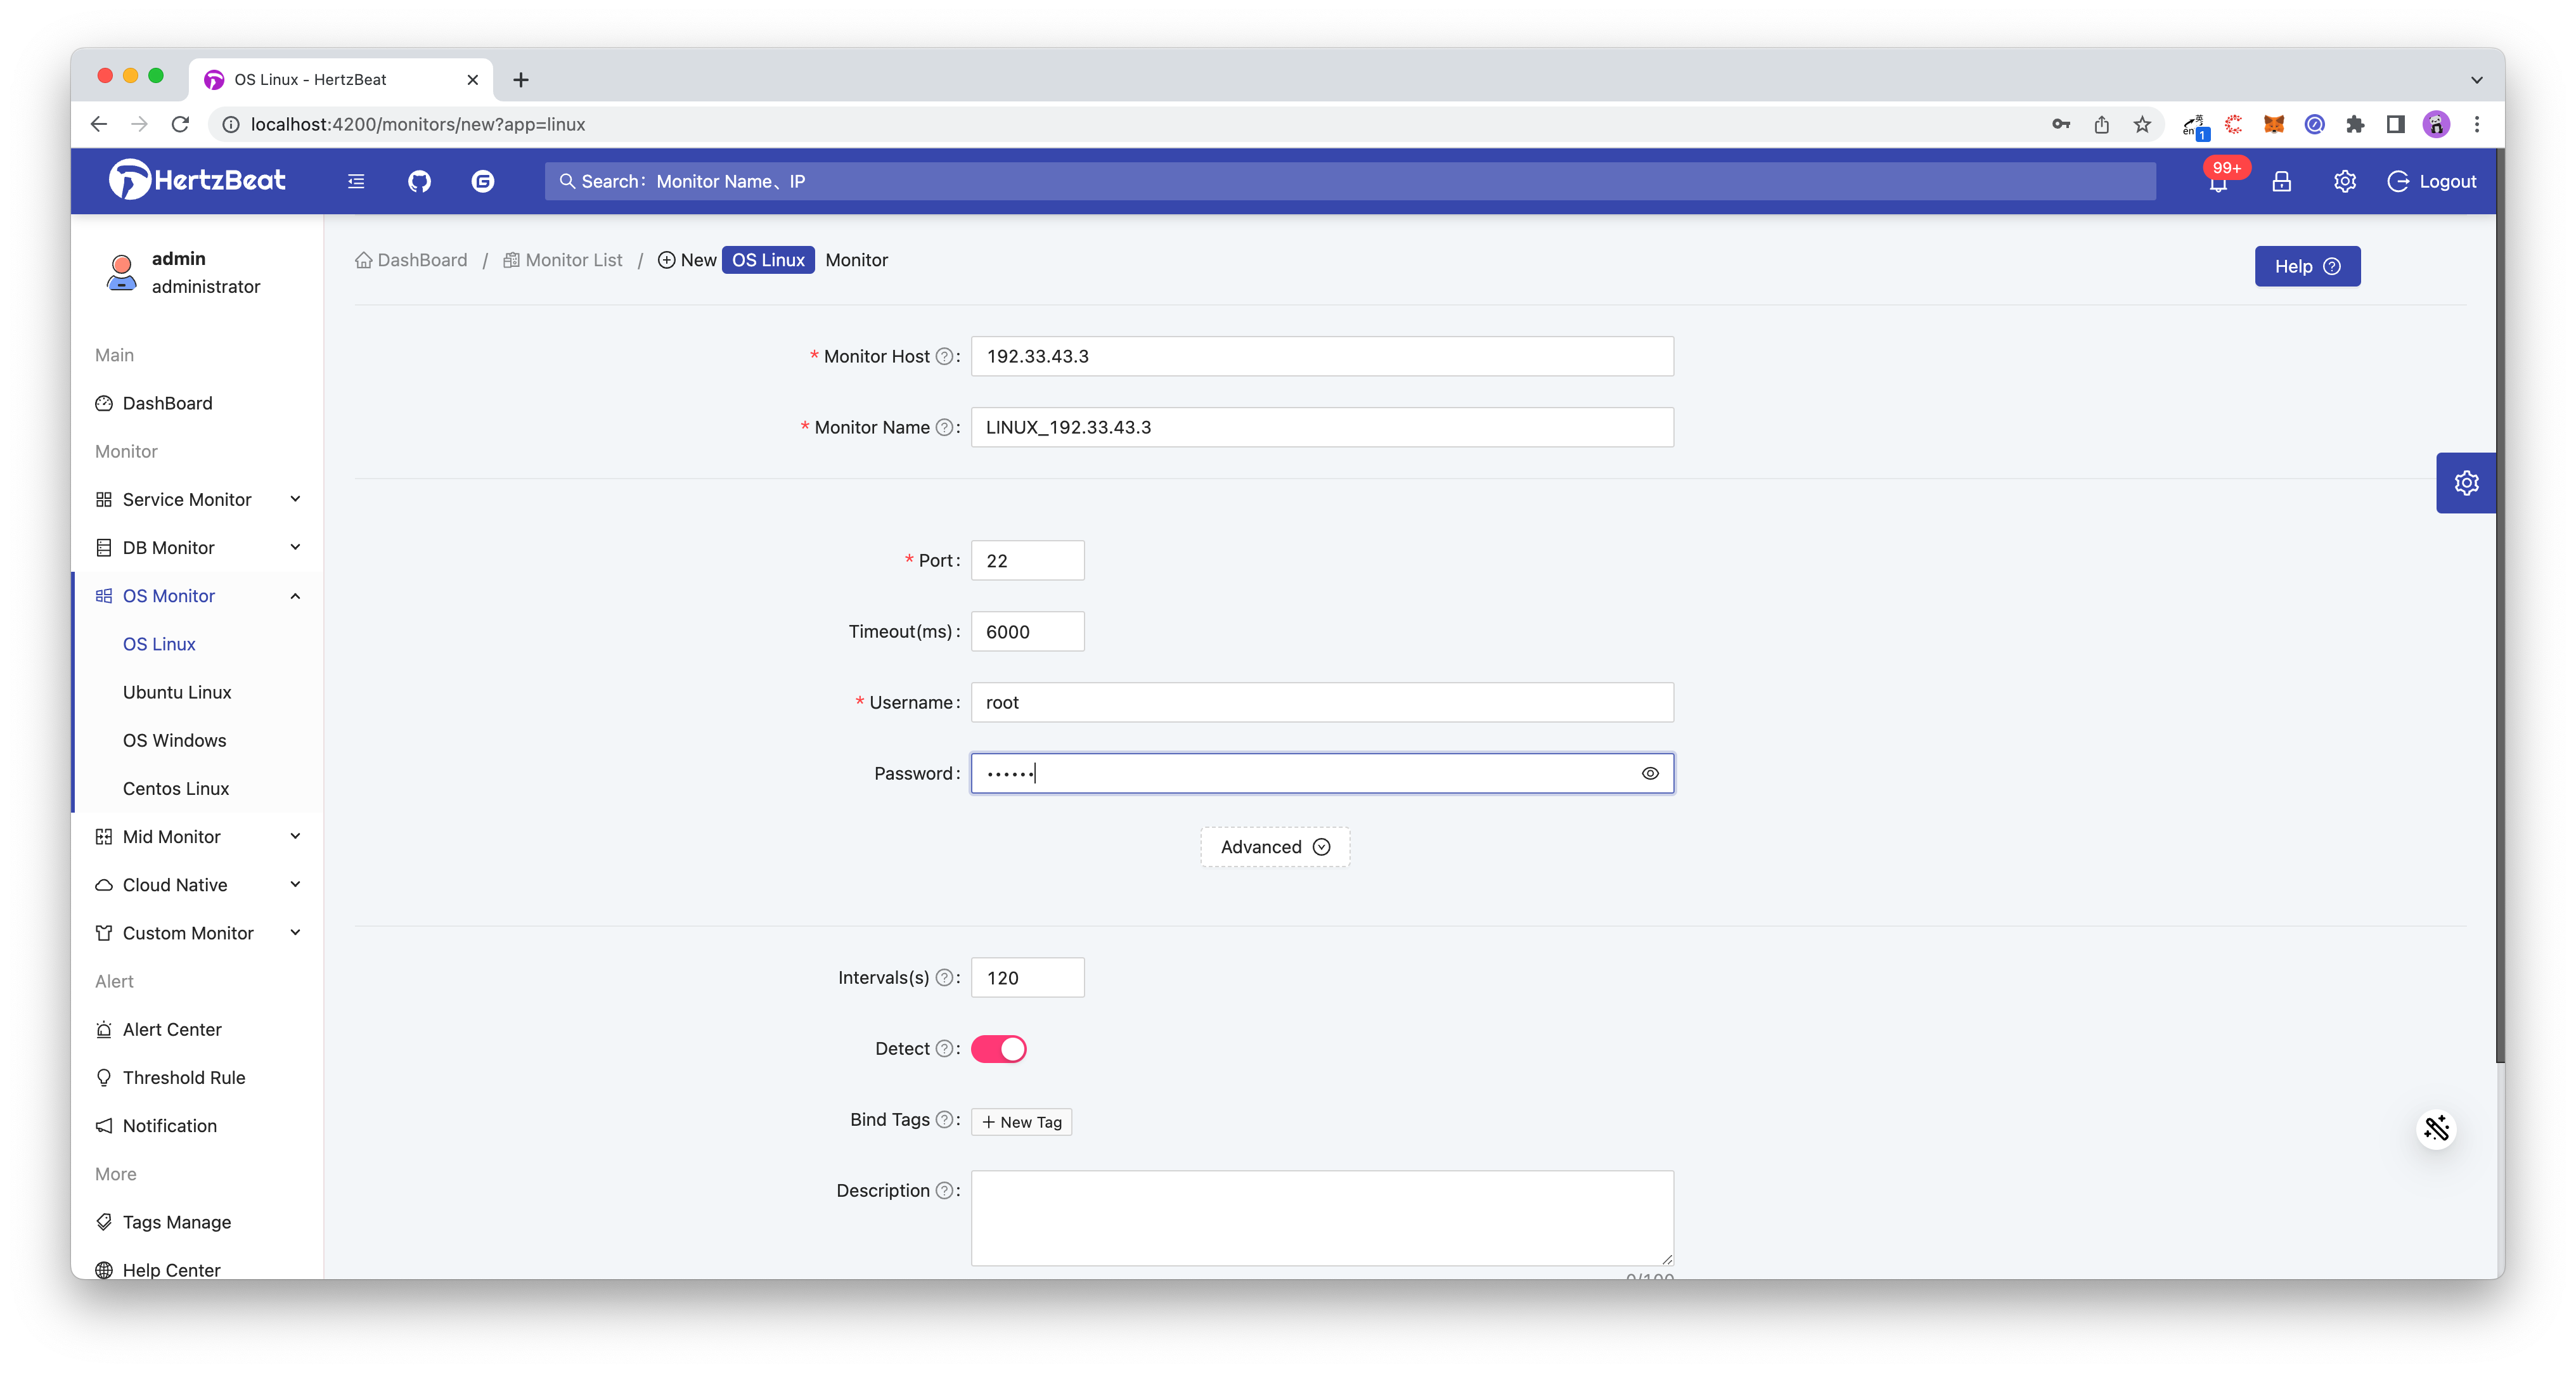
Configure the parameters required for new monitoring Linux
Fill in the Linux peer IP, SSH port (default 22), account password, etc. on the monitoring page, and finally click OK to add. For other parameters such as collection interval, timeout period, etc., please refer to the help document https://hertzbeat.apache.org/docs/help/mysql/
-
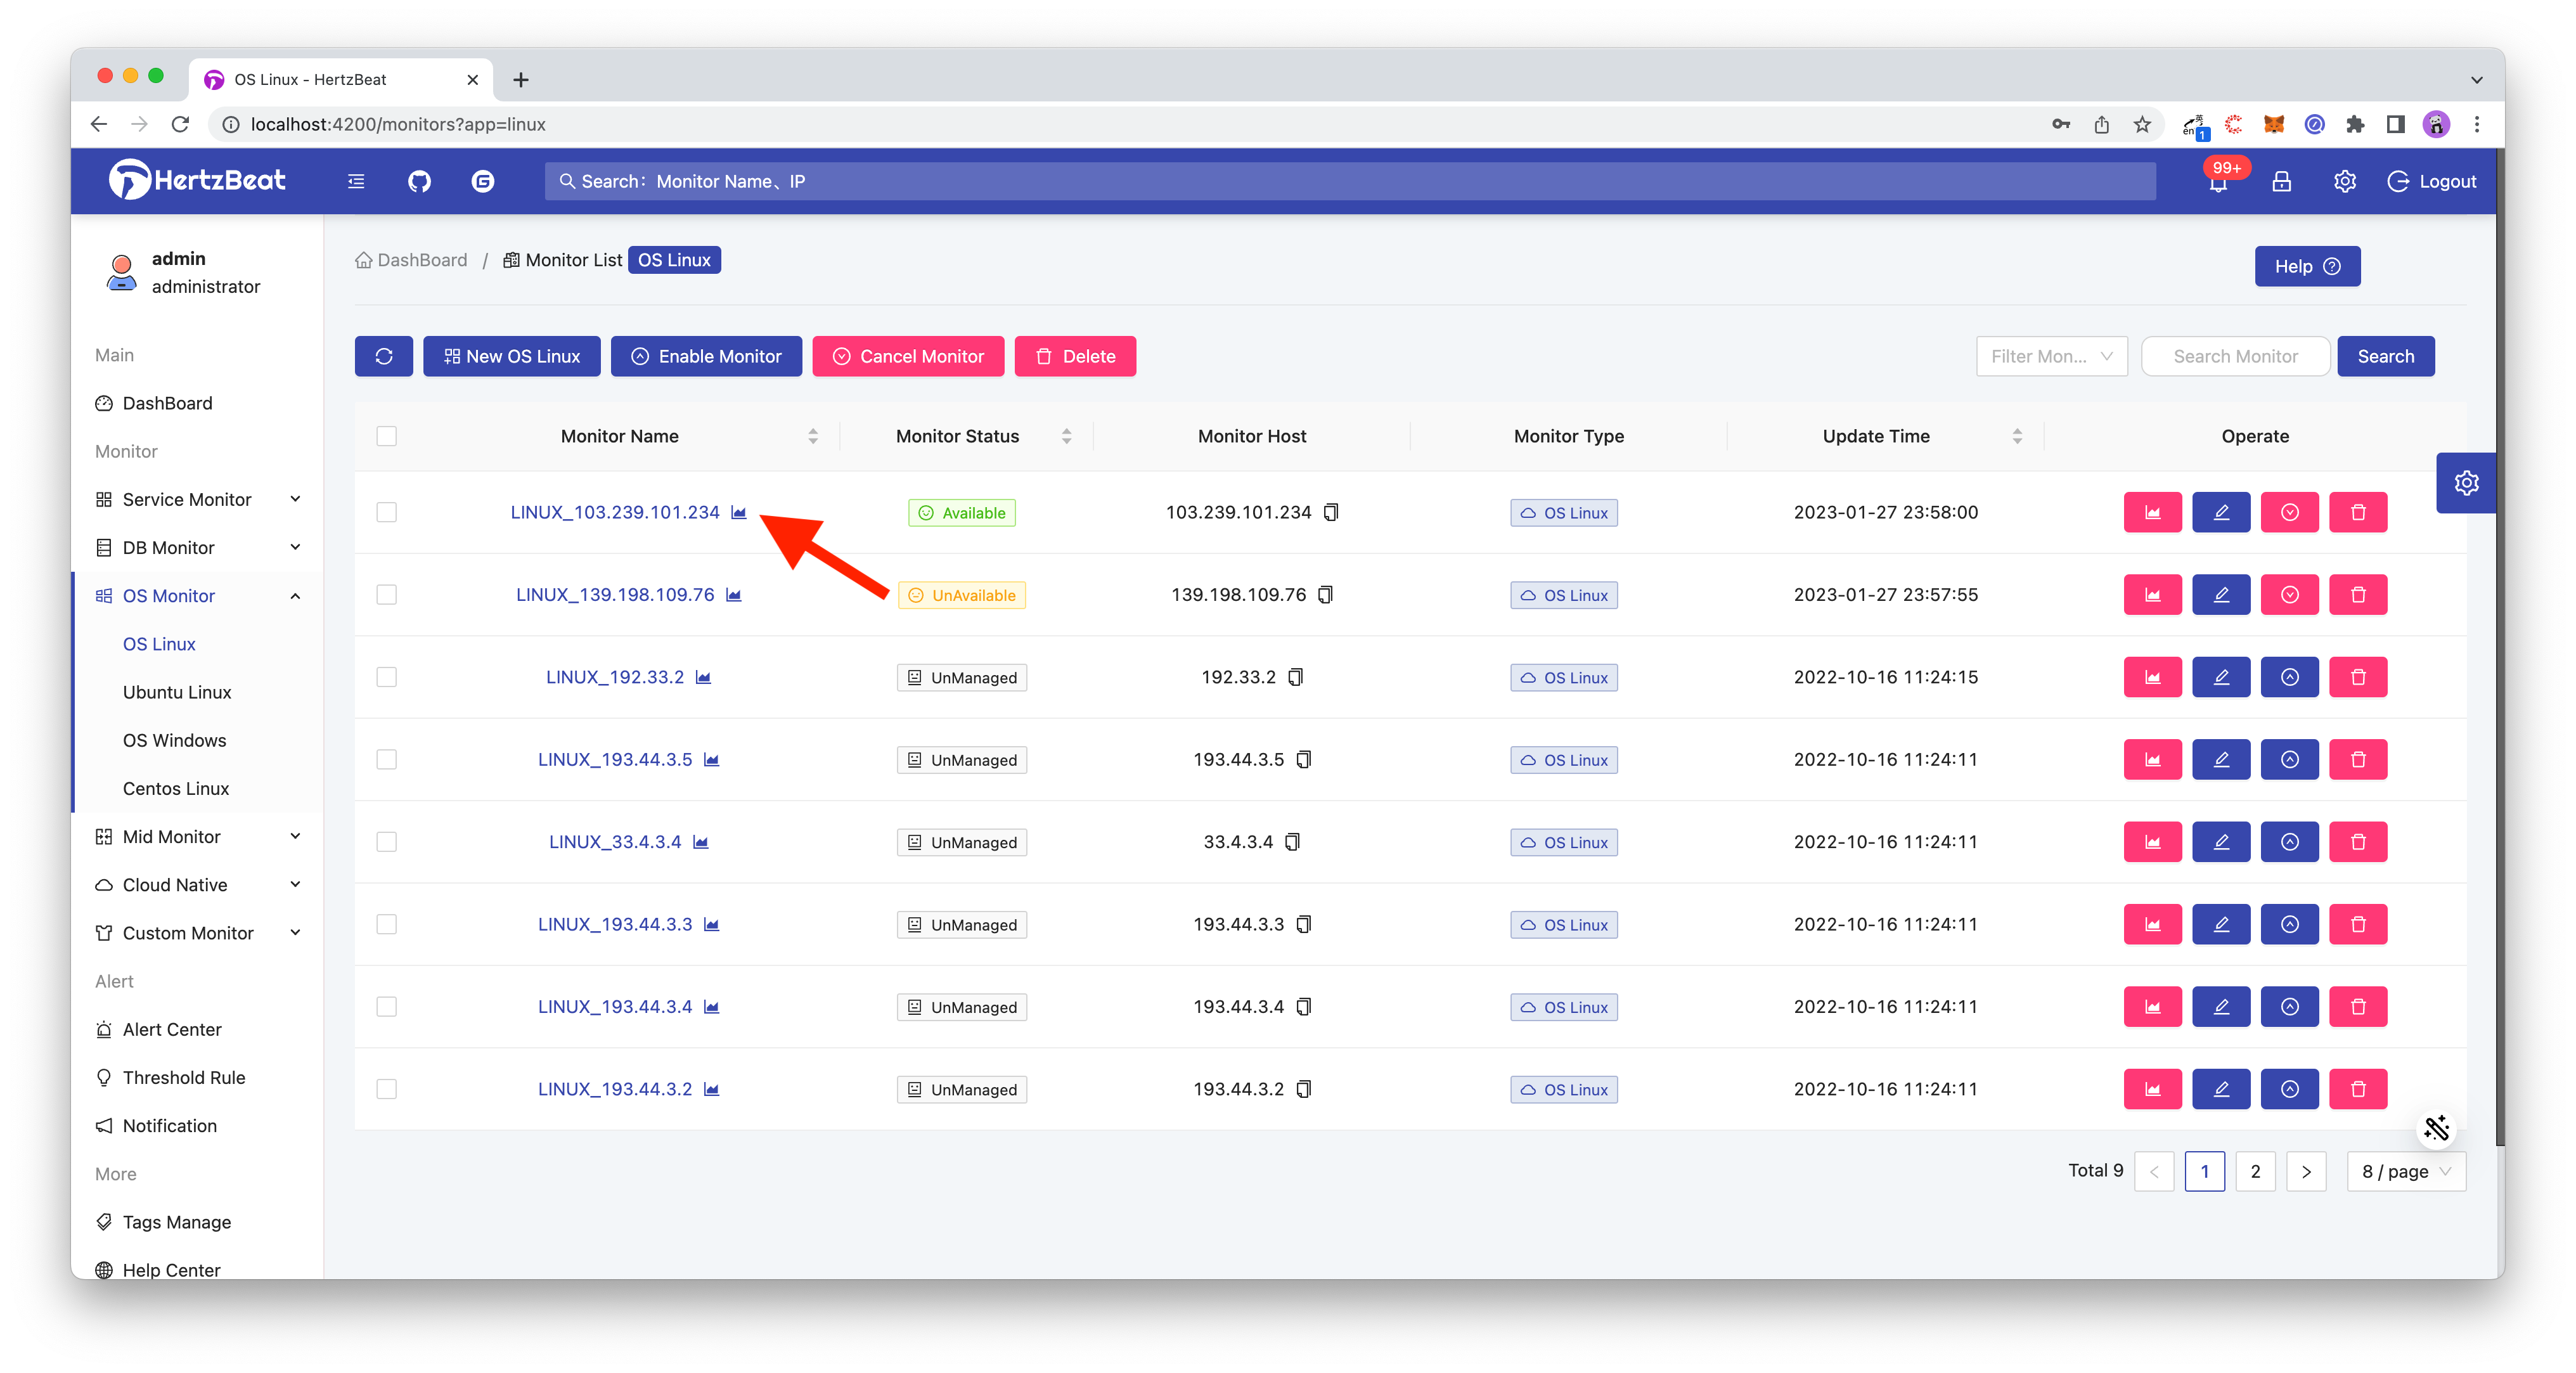
Complete ✅, now we have added the monitoring of Linux, check the monitoring list to see our added items.
-
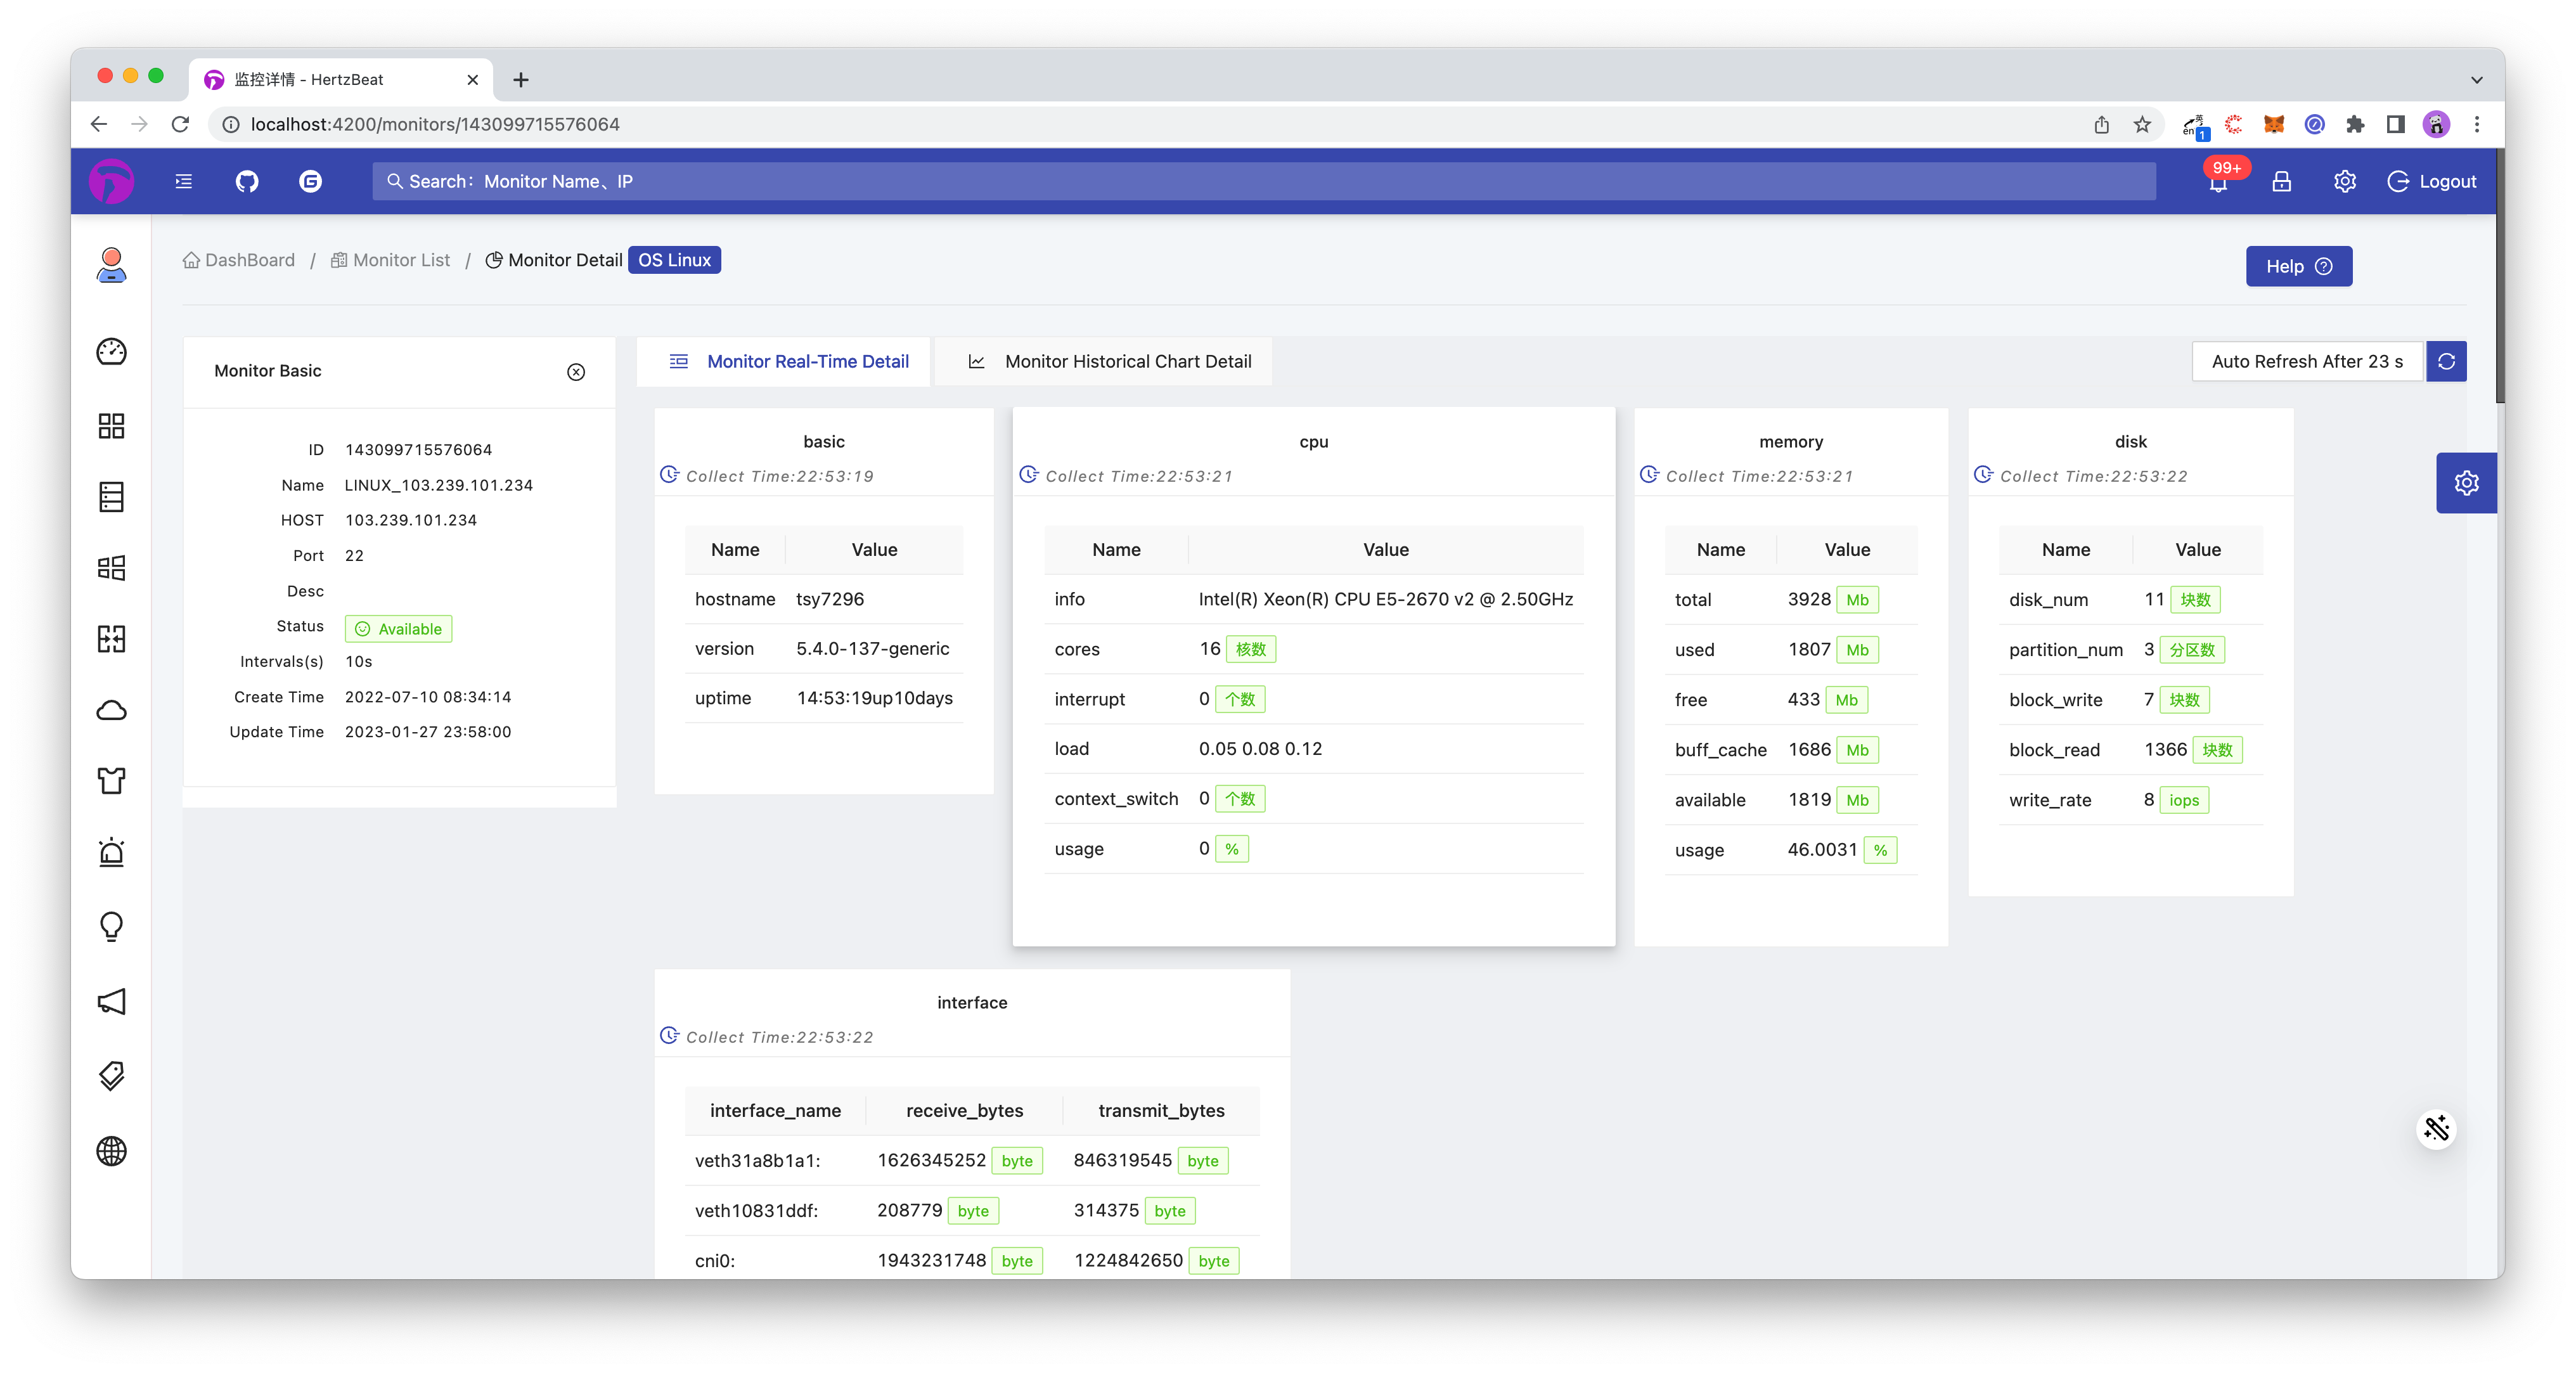
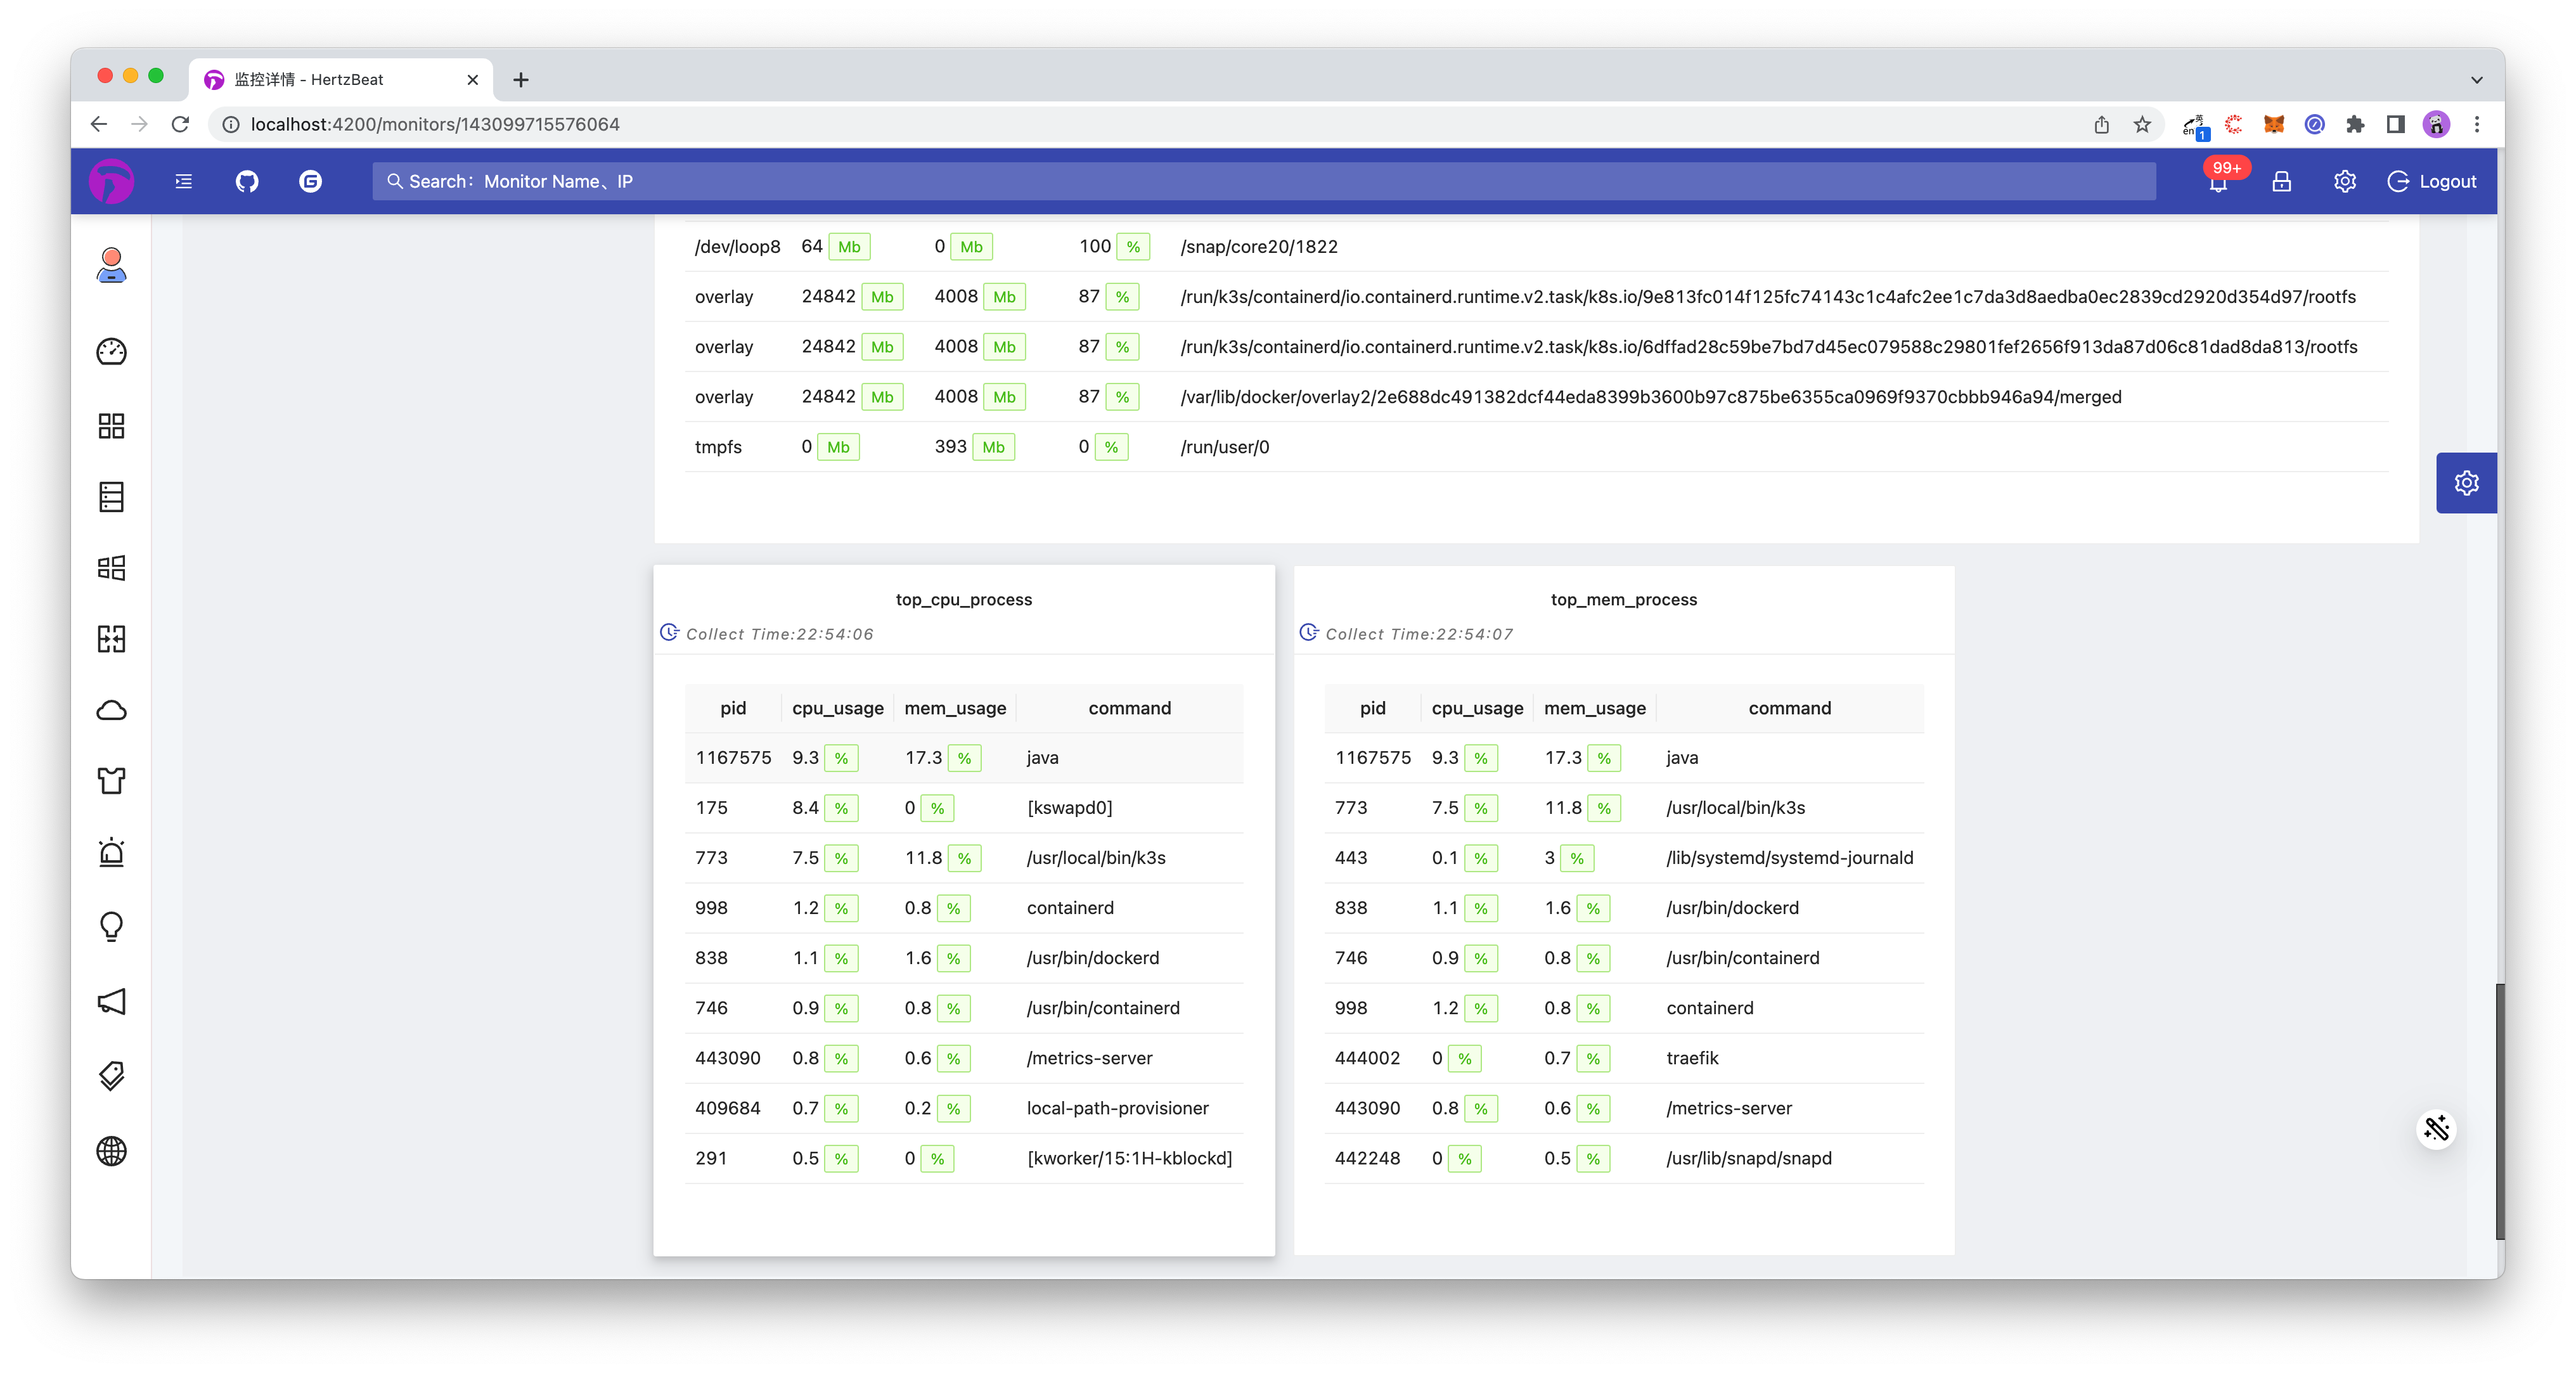
Click Operation->Monitoring Details Icon of the monitoring list item to browse the real-time monitoring metric data of Linux.
-
Click Monitoring History Details TAB to browse the historical monitoring metric data chart of Linux📈.
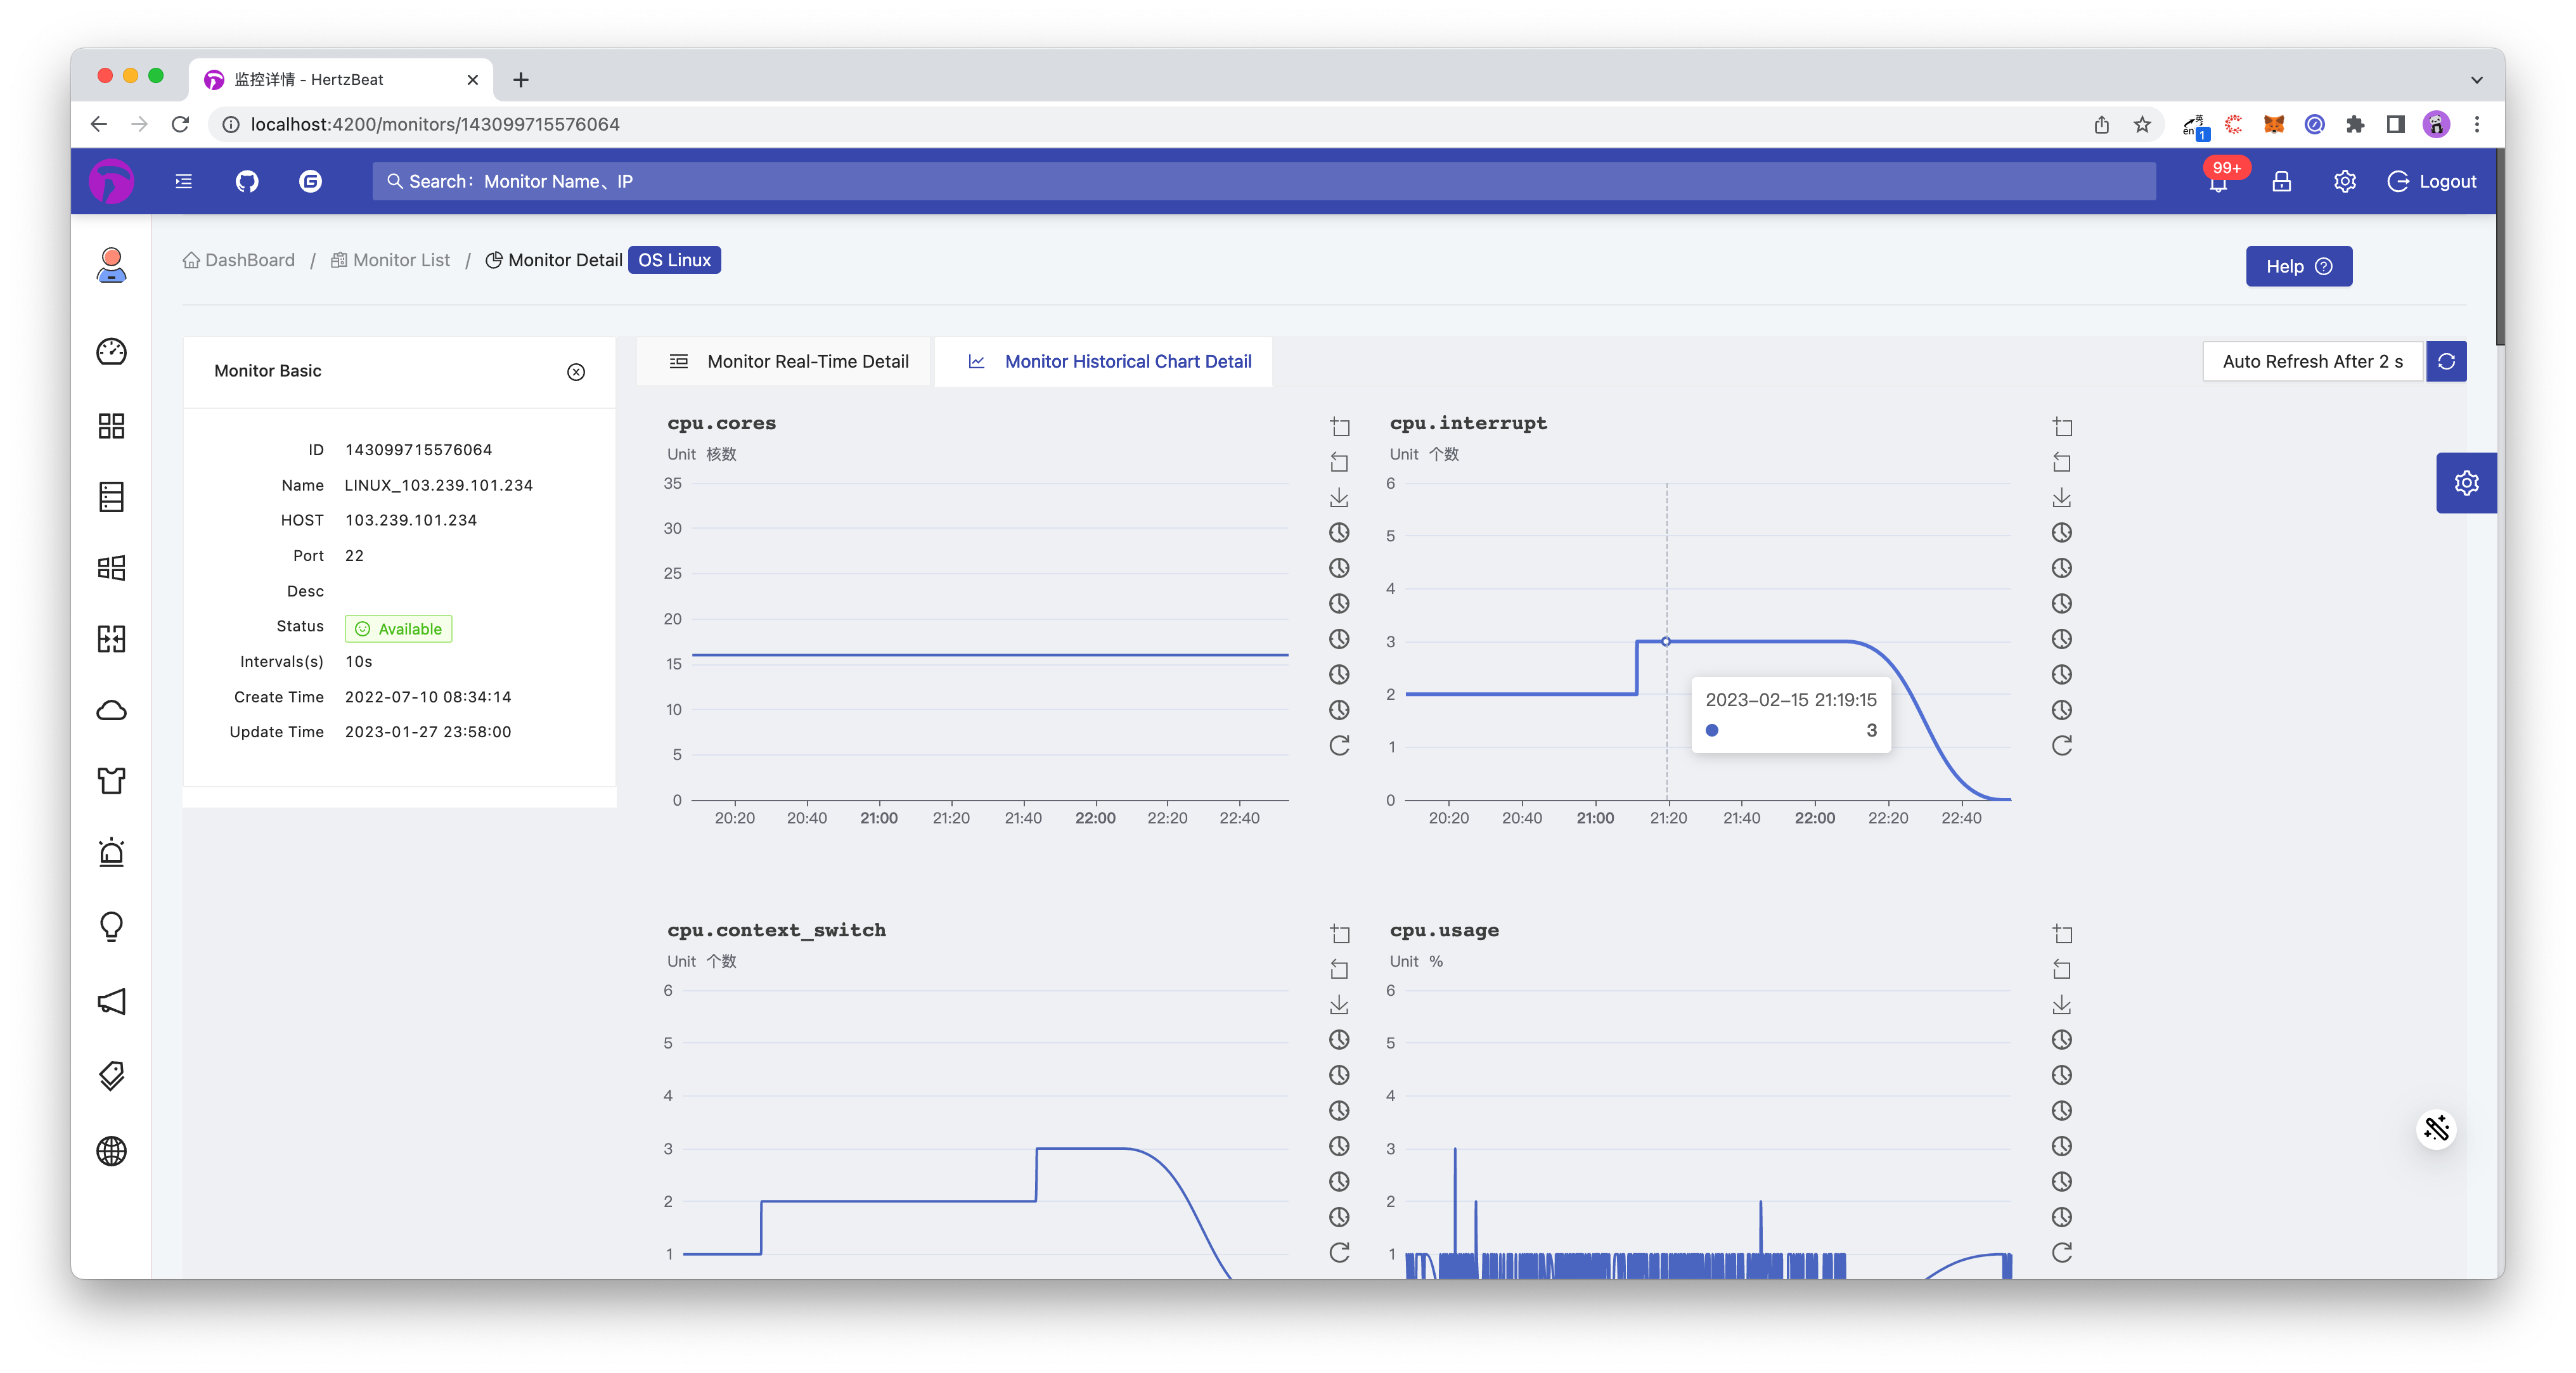
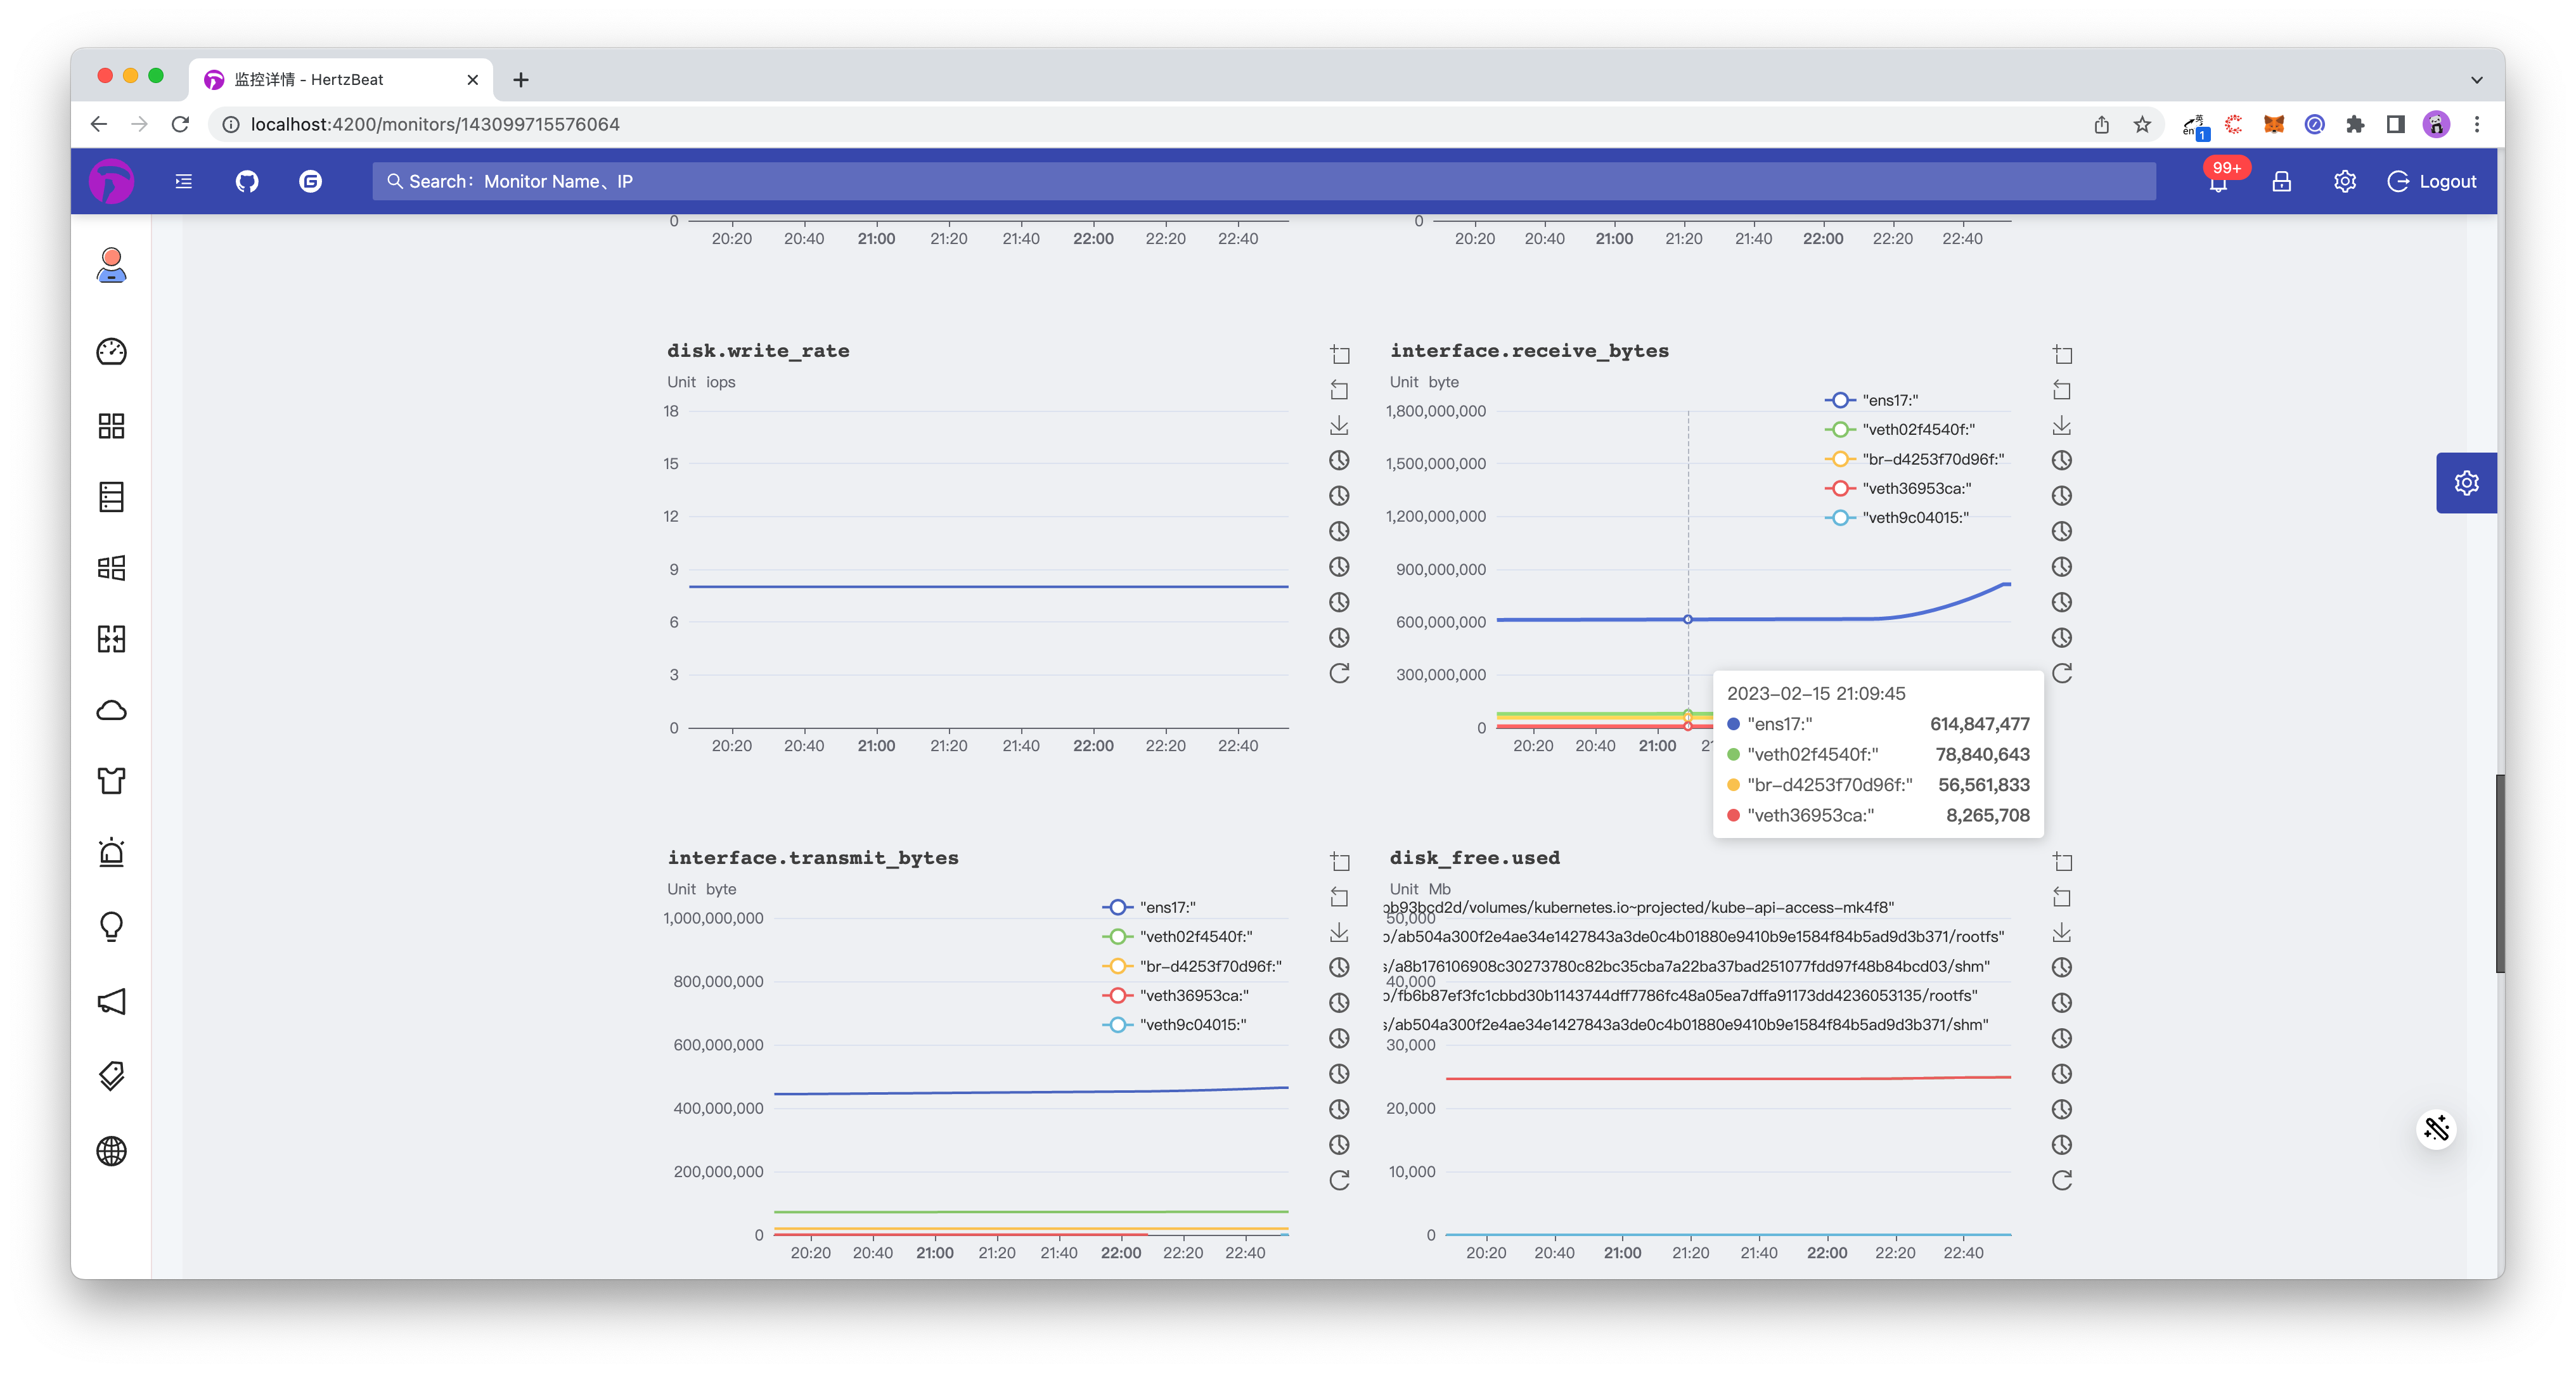
DONE! Done! To sum up, it only takes one step
- On the HertzBeat monitoring page, configure the IP port account password and add Linux monitoring
Through the above two steps, we have completed the monitoring of Linux. We can view the monitoring details and metrics in HertzBeat at any time to observe its service status. Of course, just looking at it is definitely not perfect. Monitoring is often accompanied by alarm thresholds. When Linux performance metrics exceed our expectations or are abnormal, we can promptly notify our corresponding person in charge. The person in charge receives the notification and handles the problem. It is a complete monitoring and alarm process.
Next, we will demonstrate step by step how to configure threshold alarm notifications in the HertzBeat system, so that when Linux metrics are found to be abnormal, they will be notified to us in time
3. Add Linux metric threshold alarm in HertzBeat system
-
Configure an alarm threshold for an important metric
Path: Menu -> Threshold Rules -> Add Threshold
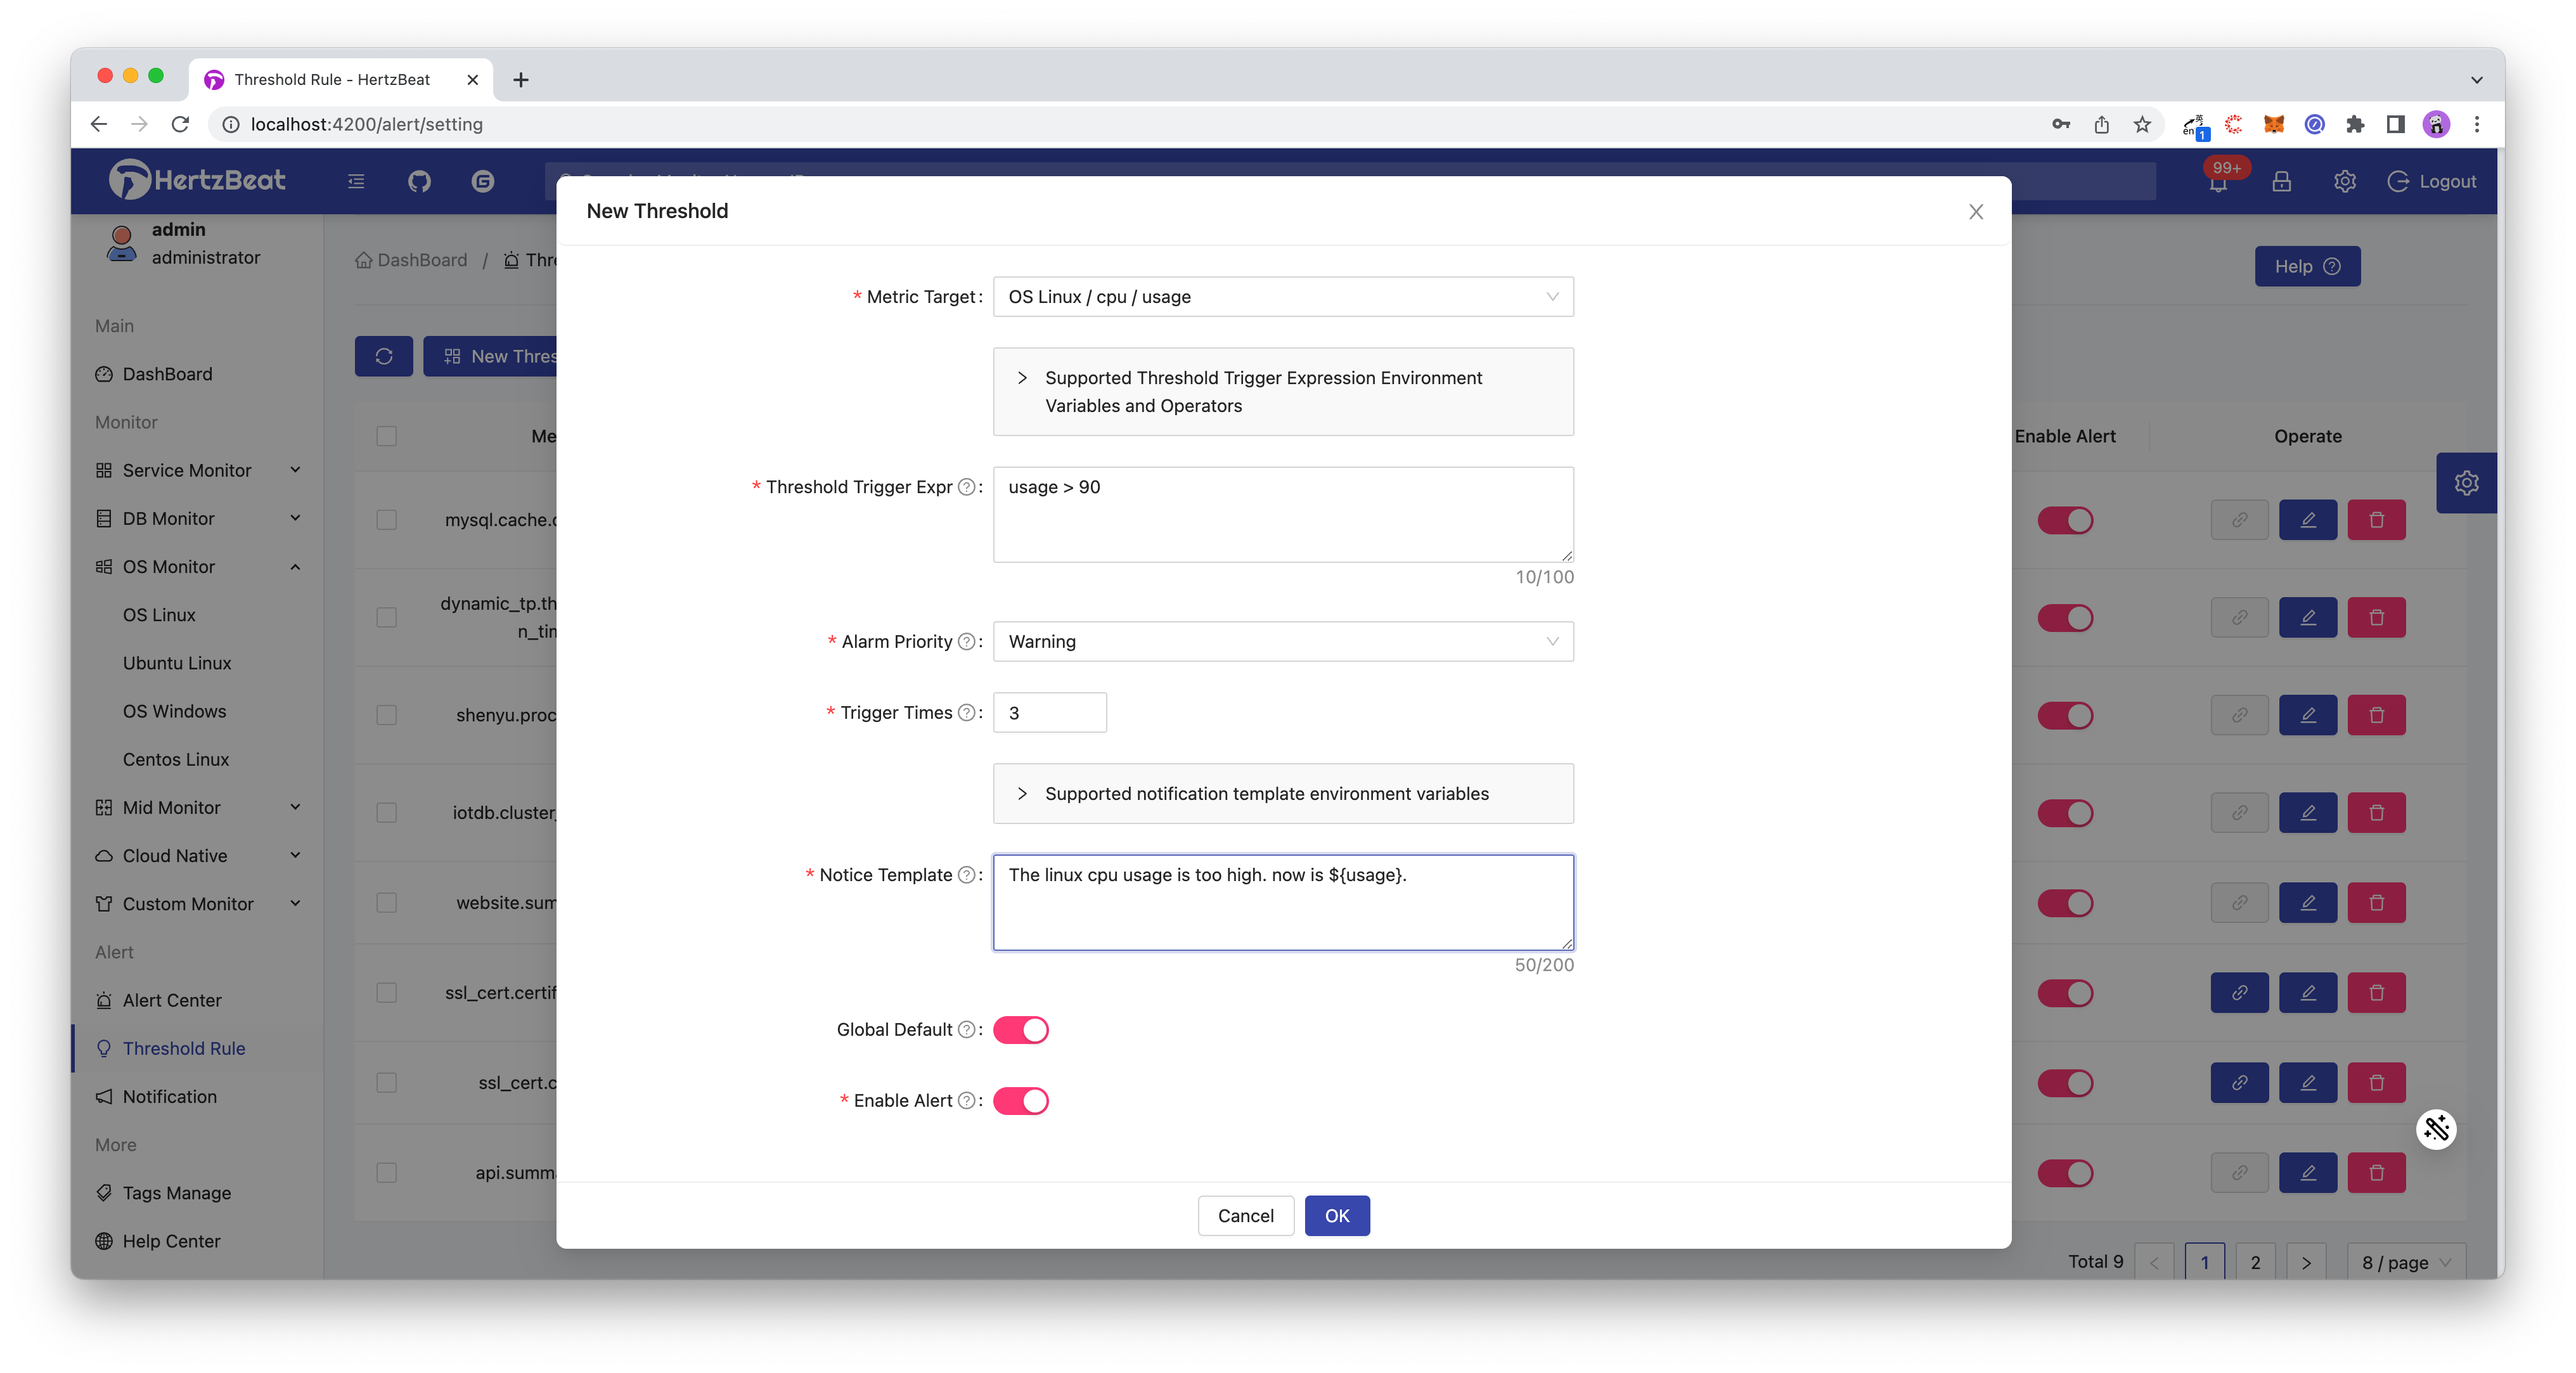
- Select the configured metric object. Linux monitors mainly related metrics such as cpu, memory, disk, network performance, etc. For example, we set the threshold for the metric
CPU utilizationcpu->usage. When the Linux cpu utilization is greater than 90% When a warning is issued. - Here we configure to send an alarm when the
usage>90of this metriccpu, the alarm level is Warning Alarm, which will be triggered after three times, as shown in the figure below.
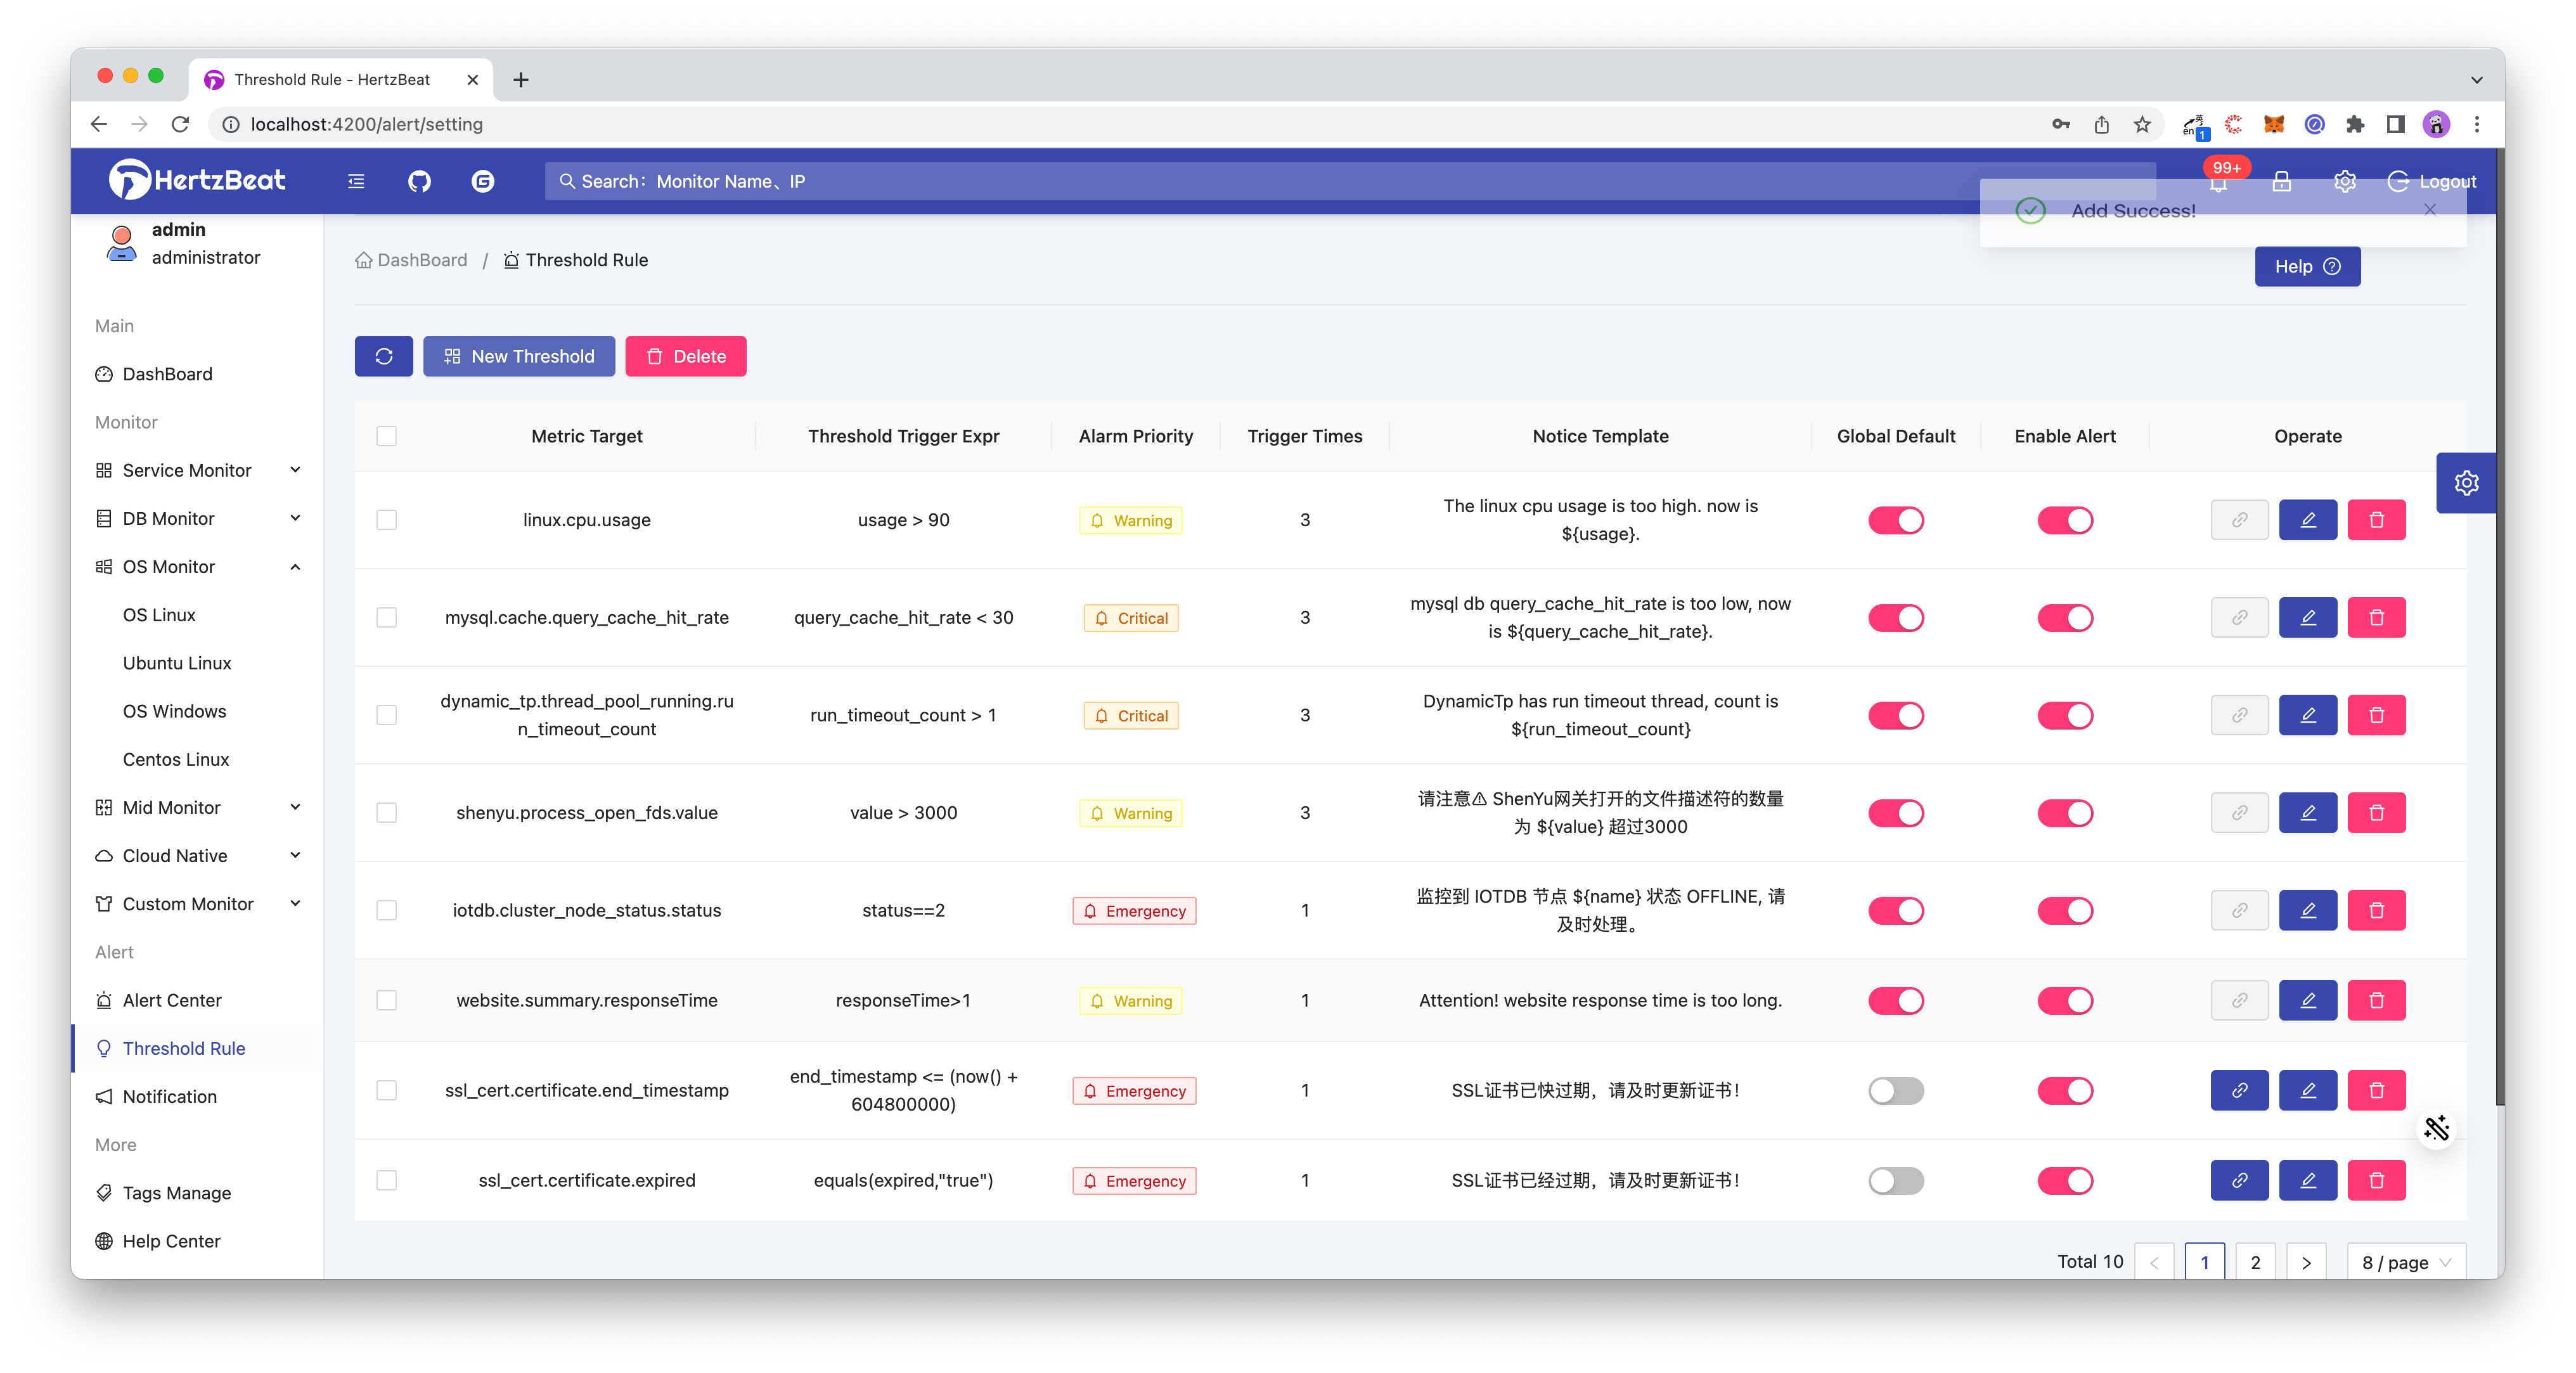
- Select the configured metric object. Linux monitors mainly related metrics such as cpu, memory, disk, network performance, etc. For example, we set the threshold for the metric
-
Add message notification recipients
Configure the receiver to let the alarm message know who to send and how to send it.
Path: Menu -> Alarm Notification -> Alarm Recipient -> Add New Recipient
Message notification methods support email, DingTalk, WeChat Work, Feishu, WebHook, SMS, etc. Here we take the commonly used DingTalk as an example.
- Refer to this Help Documentation https://hertzbeat.apache.org/docs/help/alert_dingtalk to configure the robot on DingTalk and set the security custom keyword
HertzBeat, get the correspondingaccess_tokenvalue. - Configure the receiver parameters in HertzBeat as follows.
【Alarm Notification】->【New Recipient】->【Select DingTalk Robot Notification Method】->【Set DingTalk Robot ACCESS_TOKEN】->【OK】

- Refer to this Help Documentation https://hertzbeat.apache.org/docs/help/alert_dingtalk to configure the robot on DingTalk and set the security custom keyword
-
Configure the associated alarm notification strategy ⚠️ [Add notification strategy] -> [Associate the recipient just set] -> [OK]
Configure the alarm notification policy to bind the alarm message with the receiver, so that you can decide which alarms to send to whom.

Finished, now wait for the warning message to come. ding ding ding ding
[HertzBeat warning notification]
Alarm target object: linux.cpu.usage
Affiliated monitoring ID: 483783444839382
Belonging monitoring name: Linux_182.33.34.2
Alarm level: warning alarm
Alarm trigger time: 2023-02-15 21:13:44
Content details: The linux cpu usage is too high. now is 95.
Summary
This practical article took us to experience how to use the open source real-time monitoring tool HertzBeat to monitor Linux metric data. We can find that HertzBeat, which integrates monitoring-alarm-notification, is more convenient in operation and use. Linux can be included in the monitoring and alarm notification, and there is no need to deploy multiple components and write configuration files.
Only one docker command is needed to install and experience heartbeat:
docker run -d -p 1157:1157 --name hertzbeat apache/hertzbeat
What is Hertz Beat?
HertzBeat Hertz Beat is a real-time monitoring and alarm system with powerful custom monitoring capabilities and no Agent required. Monitoring of application services, databases, operating systems, middleware, cloud native, etc., threshold alarms, and alarm notifications (email, WeChat, Dingding, Feishu, SMS, Discord, Slack, Telegram).
We make protocol specifications such as
Http, Jmx, Ssh, Snmp, Jdbc, Prometheusconfigurable, and you only need to configure YML to use these protocols to customize and collect any metrics you want to collect. Do you believe that you can immediately adapt to a new monitoring type such as K8s or Docker just by configuring YML?The powerful customization of
HertzBeat, multi-type support, easy expansion, and low coupling, hope to help developers and small and medium-sized teams quickly build their own monitoring tools.
Github: https://github.com/apache/hertzbeat Gitee: https://gitee.com/hertzbeat/hertzbeat
⛄ Supported
- Website Monitoring, Port Availability, Http Api, Ping Connectivity, Jvm, SiteMap, Ssl Certificate, SpringBoot, FTP Server
- Mysql, PostgreSQL, MariaDB, Redis, ElasticSearch, SqlServer, Oracle, MongoDB, Dameng, OpenGauss, ClickHouse, IoTDB
- Linux, Ubuntu, CentOS, Windows
- Tomcat, Nacos, Zookeeper, RabbitMQ, Flink, Kafka, ShenYu, DynamicTp, Jetty, ActiveMQ -Kubernetes, Docker
- and more for your custom monitoring.
- Notification support
DiscordSlackTelegramMailDingTalkWeChatFeishuSMSWebhook.