Tutorial 2 Obtain TOKEN index value based on HTTP protocol for subsequent collection and authentication
Through this tutorial, we will describe step by step how to modify on the basis of tutorial 1, add metrics, first call the authentication interface to obtain the TOKEN, and use the TOKEN as a parameter for the subsequent metrics collection and authentication.
Before reading this tutorial, we hope that you are familiar with how to customize types, metrics, protocols, etc. from Custom Monitoring and http Protocol Customization.
Request process
【Authentication information metrics (highest priority)】【HTTP interface carries account password call】->【Response data analysis】->【Analysis and issuance of TOKEN-accessToken as an metric] -> [Assign accessToken as a variable parameter to other collection index groups]
Here we still use the hertzbeat monitoring example of Tutorial 1! The hertzbeat background interface not only supports the basic direct account password authentication used in Tutorial 1, but also supports token authentication.
We need POST to call the login interface /api/account/auth/form to get accessToken, the request body (json format) is as follows:
{
   "credential": "hertzbeat",
   "identifier": "admin"
}
The response structure data is as follows:
{
   "data": {
     "token": "xxxx",
     "refreshToken": "xxxx"
   },
   "msg": null,
   "code": 0
}
Add custom monitoring type hertzbeat_token
HertzBeat Dashboard -> Monitoring Templates -> New Template -> Config Monitoring Template Yml -> Save and Apply -> Add A Monitoring with The New Monitoring Type
We define all monitoring collection types (mysql,jvm,k8s) as yml monitoring templates, and users can import these templates to support corresponding types of monitoring.
Monitoring template is used to define the name of monitoring type(international), request parameter mapping, index information, collection protocol configuration information, etc.
- The custom monitoring type needs to add a new configuration monitoring template yml. We directly reuse the
hertzbeatmonitoring type in Tutorial 1 and modify it based on it
A monitoring configuration definition file named after the monitoring type - hertzbeat_token
We directly reuse the definition content in hertzbeat and modify it to our current monitoring type hertzbeat_auth configuration parameters, such as app, category, etc.
category: custom
# The monitoring type eg: linux windows tomcat mysql aws...
app: hertzbeat_token
# The monitoring i18n name
name:
  zh-CN: HertzBeat(Token)
  en-US: HertzBeat(Token)
# The description and help of this monitoring type
help:
  zh-CN: HertzBeat 对 HertzBeat监控(Token)进行测量监控。`<br>`您可以点击 “`<i>`新建 HertzBeat监控(Token)`</i>`” 并进行配置,或者选择“`<i>`更多操作`</i>`”,导入已有配置。
  en-US: HertzBeat monitors HertzBeat Monitor(Token). You could click the "`<i>`New HertzBeat Monitor(Token)`</i>`" button and proceed with the configuration or import an existing setup through the "`<i>`More Actions`</i>`" menu.
  zh-TW: HertzBeat對HertzBeat監控(Token)進行量測監控。`<br>`您可以點擊“`<i>`新建HertzBeat監控(Token)`</i>`”並進行配寘,或者選擇“`<i>`更多操作`</i>`”,導入已有配寘。
helpLink:
  zh-CN: https://hertzbeat.apache.org/zh-cn/docs/help/hertzbeat_token
  en-US: https://hertzbeat.apache.org/docs/help/hertzbeat_token
# Input params define for monitoring(render web ui by the definition)
params:
  # field-param field key
  - field: host
    # name-param field display i18n name
    name:
      zh-CN: 目标Host
      en-US: Target Host
    # type-param field type(most mapping the html input type)
    type: host
    # required-true or false
    required: true
  - field: port
    name:
      zh-CN: 端口
      en-US: Port
    # type-param field type(most mapping the html input type)
    type: number
    # when type is number, range is required
    range: '[0,65535]'
    required: true
    defaultValue: 1157
    placeholder: 'Please input port'
  - field: ssl
    name:
      zh-CN: 启动SSL
      en-US: SSL
    # type-param field type(boolean mapping the html switch tag)
    type: boolean
    required: false
  - field: contentType
    name:
      zh-CN: Content-Type
      en-US: Content-Type
    type: text
    placeholder: 'Request Body Type'
    required: false
  - field: payload
    name:
      zh-CN: 请求BODY
      en-US: BODY
    type: textarea
    placeholder: 'Available When POST PUT'
    required: false
# collect metrics config list
Define metrics auth login request to get token
- Add an index group definition
authinhertzbeat_token, set the collection priority to the highest 0, and collect the indextoken.
category: custom
# The monitoring type eg: linux windows tomcat mysql aws...
app: hertzbeat_token
# The monitoring i18n name
name:
  zh-CN: HertzBeat(Token)
  en-US: HertzBeat(Token)
# The description and help of this monitoring type
help:
  zh-CN: HertzBeat 对 HertzBeat监控(Token)进行测量监控。`<br>`您可以点击 “`<i>`新建 HertzBeat监控(Token)`</i>`” 并进行配置,或者选择“`<i>`更多操作`</i>`”,导入已有配置。
  en-US: HertzBeat monitors HertzBeat Monitor(Token). You could click the "`<i>`New HertzBeat Monitor(Token)`</i>`" button and proceed with the configuration or import an existing setup through the "`<i>`More Actions`</i>`" menu.
  zh-TW: HertzBeat對HertzBeat監控(Token)進行量測監控。`<br>`您可以點擊“`<i>`新建HertzBeat監控(Token)`</i>`”並進行配寘,或者選擇“`<i>`更多操作`</i>`”,導入已有配寘。
helpLink:
  zh-CN: https://hertzbeat.apache.org/zh-cn/docs/help/hertzbeat_token
  en-US: https://hertzbeat.apache.org/docs/help/hertzbeat_token
# Input params define for monitoring(render web ui by the definition)
params:
  # field-param field key
  - field: host
    # name-param field display i18n name
    name:
      zh-CN: 目标Host
      en-US: Target Host
    # type-param field type(most mapping the html input type)
    type: host
    # required-true or false
    required: true
  - field: port
    name:
      zh-CN: 端口
      en-US: Port
    # type-param field type(most mapping the html input type)
    type: number
    # when type is number, range is required
    range: '[0,65535]'
    required: true
    defaultValue: 1157
    placeholder: 'Please input port'
  - field: ssl
    name:
      zh-CN: 启动SSL
      en-US: SSL
    # type-param field type(boolean mapping the html switch tag)
    type: boolean
    required: false
  - field: contentType
    name:
      zh-CN: Content-Type
      en-US: Content-Type
    type: text
    placeholder: 'Request Body Type'
    required: false
  - field: payload
    name:
      zh-CN: 请求BODY
      en-US: BODY
    type: textarea
    placeholder: 'Available When POST PUT'
    required: false
# collect metrics config list
metrics:
  # metrics - auth
  - name: auth
    # metrics scheduling priority(0->127)->(high->low), metrics with the same priority will be scheduled in parallel
    # priority 0's metrics is availability metrics, it will be scheduled first, only availability metrics collect success will the scheduling continue
    priority: 0
    # collect metrics content
    fields:
      # field-metric name, type-metric type(0-number,1-string), unit-metric unit('%','ms','MB'), label-whether it is a metrics label field
      - field: token
        type: 1
      - field: refreshToken
        type: 1
    # the protocol used for monitoring, eg: sql, ssh, http, telnet, wmi, snmp, sdk
    protocol: http
    # the config content when protocol is http
    http:
      # http host: ipv4 ipv6 domain
      host: ^_^host^_^
      # http port
      port: ^_^port^_^
      # http url
      url: /api/account/auth/form
      # http method: GET POST PUT DELETE PATCH
      method: POST
      # if enabled https
      ssl: ^_^ssl^_^
      payload: ^_^payload^_^
      # http request header content
      headers:
        content-type: ^_^contentType^_^
        ^_^headers^_^: ^_^headers^_^
      # http request params
      params:
        ^_^params^_^: ^_^params^_^
      # http response data parse type: default-hertzbeat rule, jsonpath-jsonpath script, website-for website monitoring, prometheus-prometheus exporter rule
      parseType: jsonPath
      parseScript: '$.data'
---
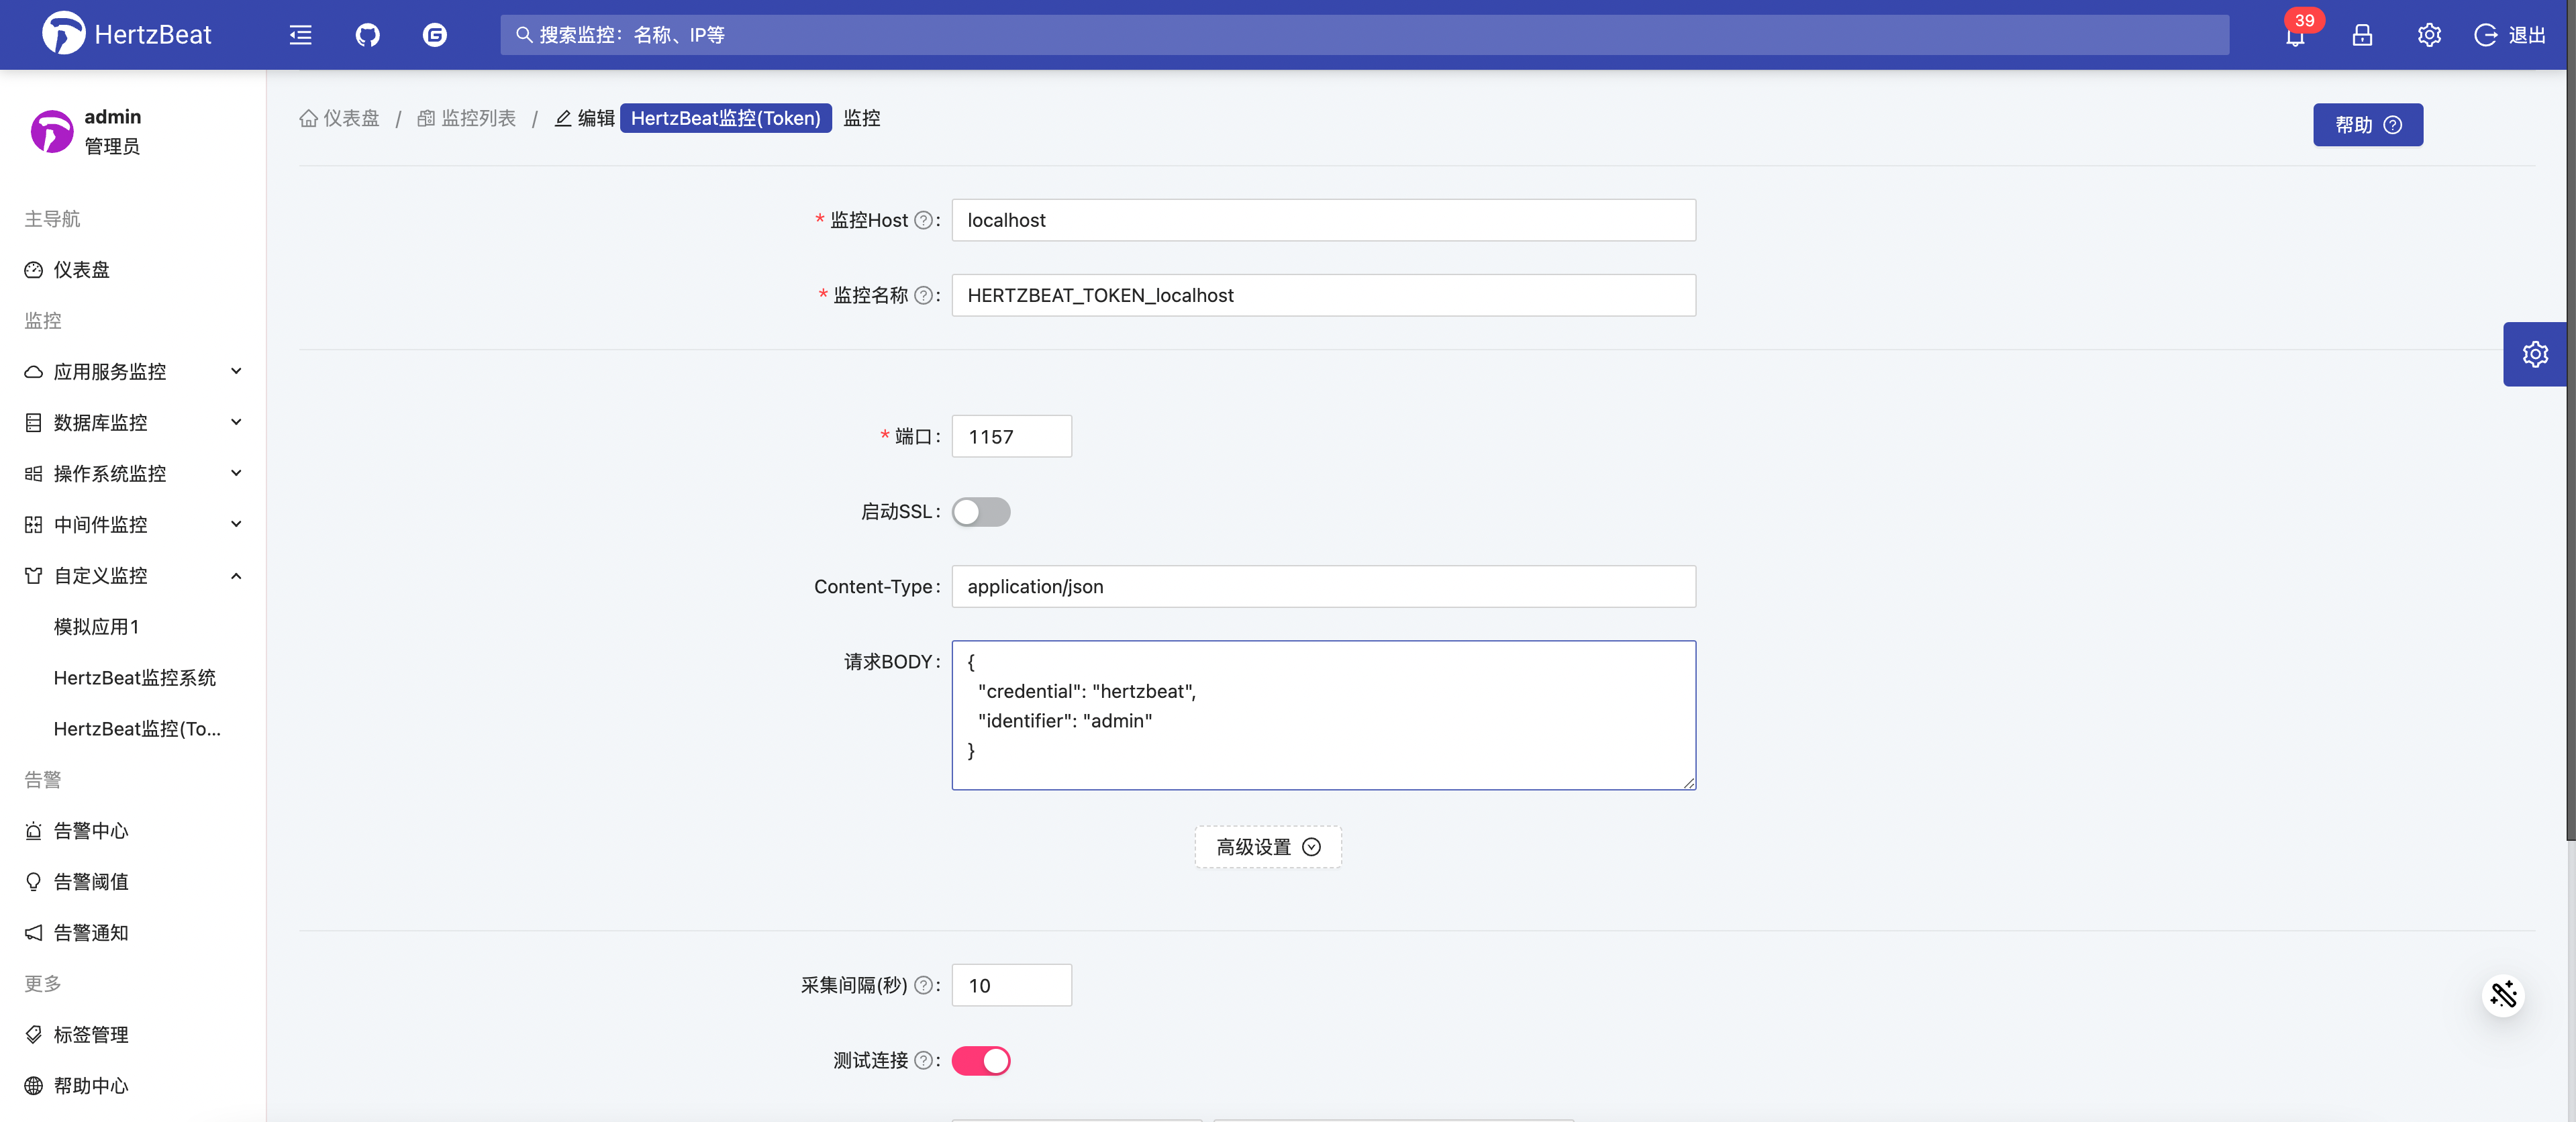
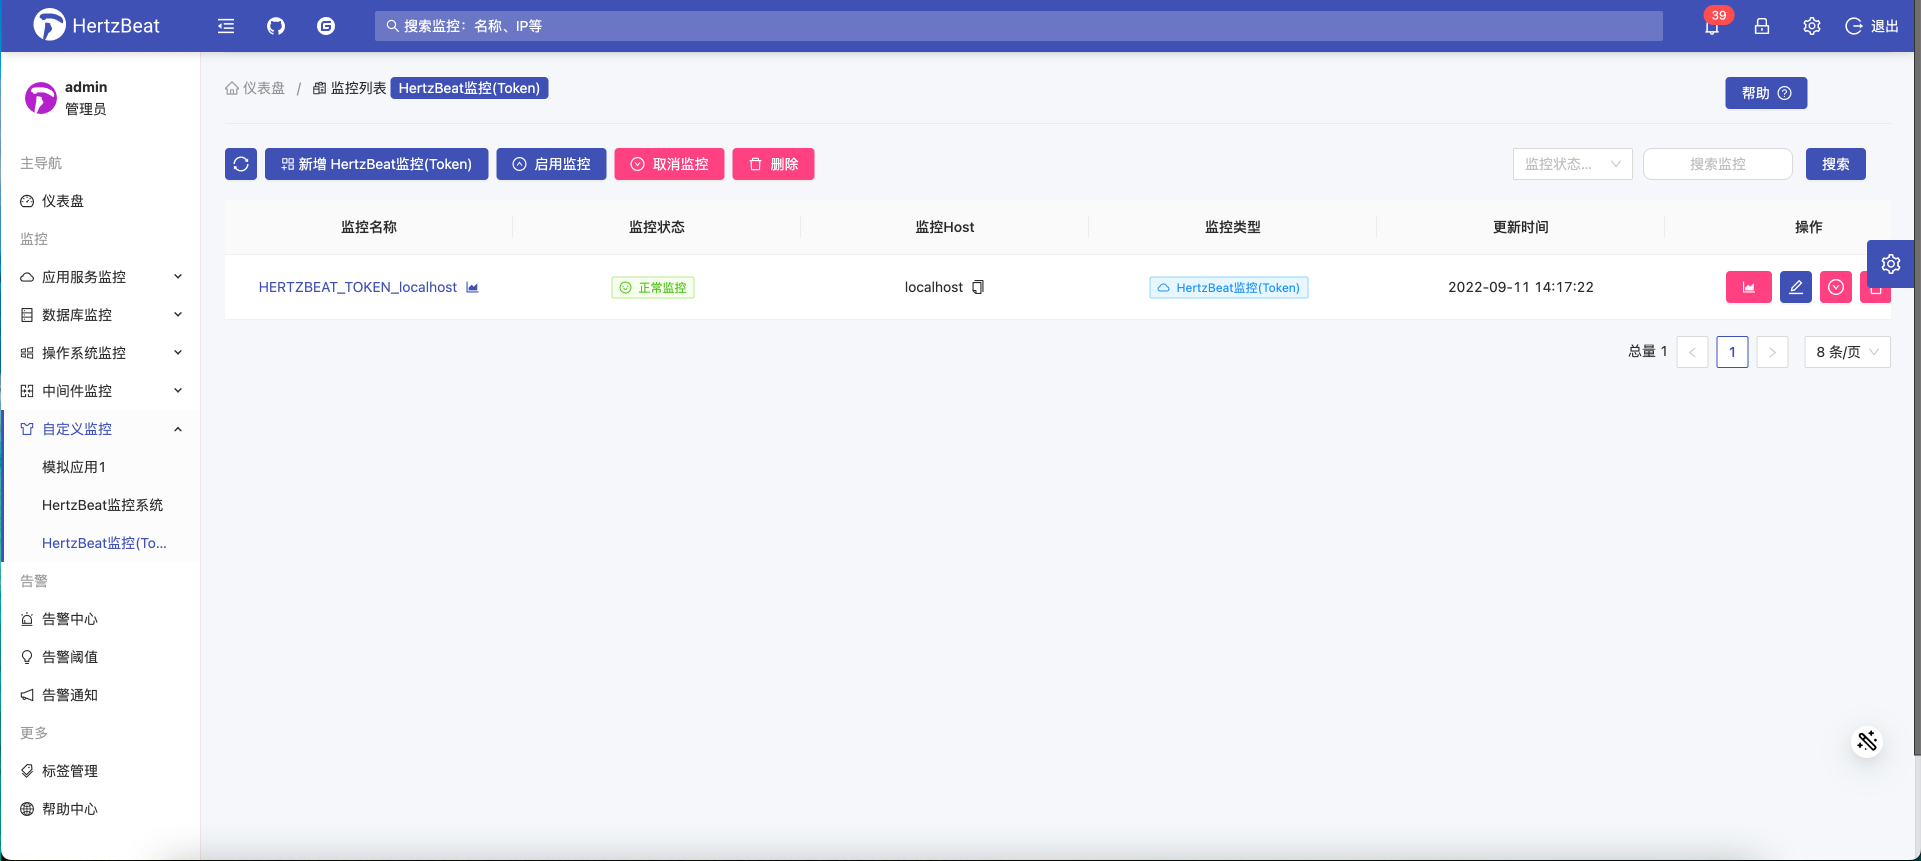
At this time, save and apply, add hertzbeat_token type monitoring on the system page, configure input parameters, content-type fill in application/json, request Body fill in the account password json as follows:
{
   "credential": "hertzbeat",
   "identifier": "admin"
}
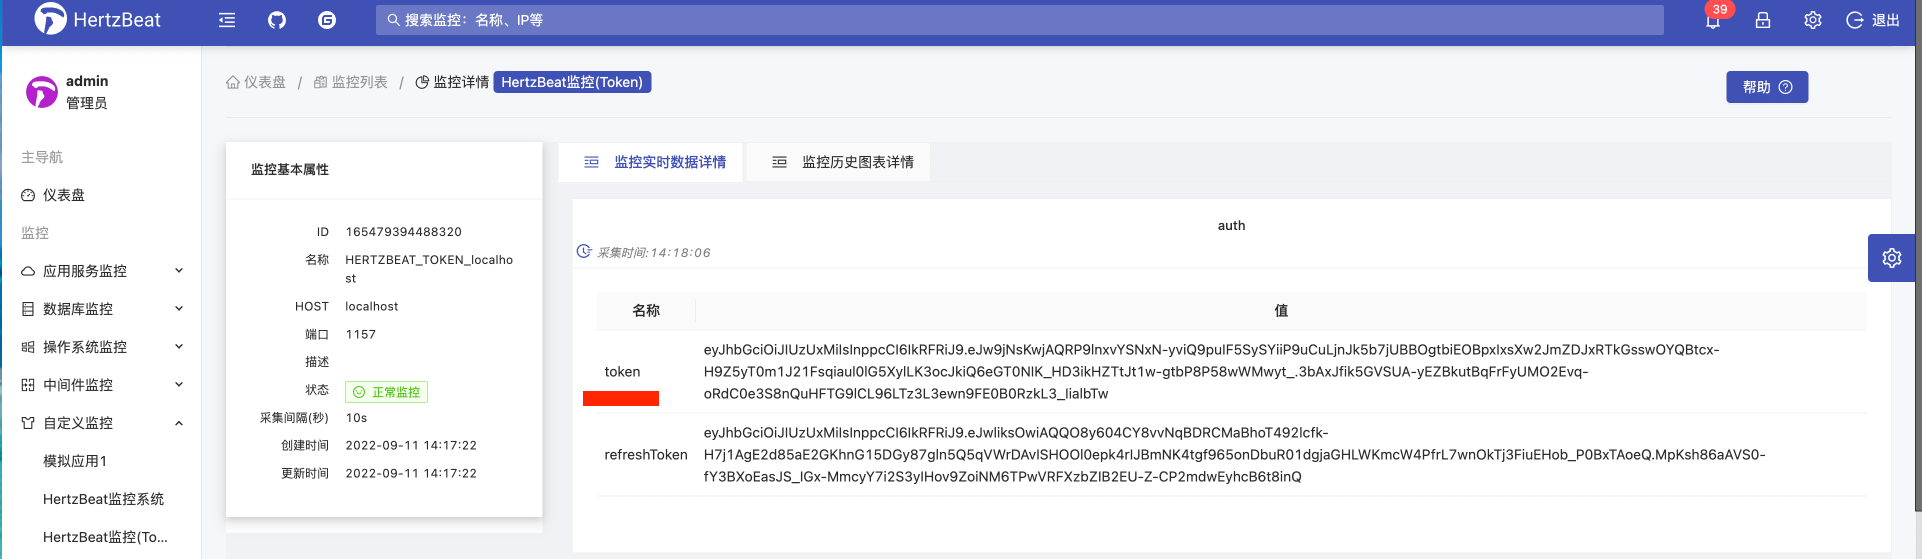
After the addition is successful, we can see the token, refreshToken metric data we collected on the details page.
Use token as a variable parameter to collect and use the following metricss
Add an index group definition summary in app-hertzbeat_token.yml, which is the same as summary in Tutorial 1, and set the collection priority to 1
Set the authentication method in the HTTP protocol configuration of this index group to Bearer Token, assign the index token collected by the previous index group auth as a parameter, and use ^o^ as the internal replacement symbol, that is ^o^token^o^. as follows:
   - name: summary
# When the protocol is the http protocol, the specific collection configuration
     http:
       # authentication
       authorization:
         # Authentication methods: Basic Auth, Digest Auth, Bearer Token
         type: Bearer Token
         bearerTokenToken: ^o^token^o^
The final hertzbeat_token template yml is defined as follows:
category: custom
# The monitoring type eg: linux windows tomcat mysql aws...
app: hertzbeat_token
# The monitoring i18n name
name:
zh-CN: HertzBeat(Token)
en-US: HertzBeat(Token)
# The description and help of this monitoring type
help:
zh-CN: HertzBeat 对 HertzBeat监控(Token)进行测量监控。`<br>`您可以点击 “`<i>`新建 HertzBeat监控(Token)`</i>`” 并进行配置,或者选择“`<i>`更多操作`</i>`”,导入已有配置。
en-US: HertzBeat monitors HertzBeat Monitor(Token). You could click the "`<i>`New HertzBeat Monitor(Token)`</i>`" button and proceed with the configuration or import an existing setup through the "`<i>`More Actions`</i>`" menu.
zh-TW: HertzBeat對HertzBeat監控(Token)進行量測監控。`<br>`您可以點擊“`<i>`新建HertzBeat監控(Token)`</i>`”並進行配寘,或者��選擇“`<i>`更多操作`</i>`”,導入已有配寘。
helpLink:
zh-CN: https://hertzbeat.apache.org/zh-cn/docs/help/hertzbeat_token
en-US: https://hertzbeat.apache.org/docs/help/hertzbeat_token
# Input params define for monitoring(render web ui by the definition)
params:
# field-param field key
- field: host
# name-param field display i18n name
name:
zh-CN: 目标Host
en-US: Target Host
# type-param field type(most mapping the html input type)
type: host
# required-true or false
required: true
- field: port
name:
zh-CN: 端口
en-US: Port
# type-param field type(most mapping the html input type)
type: number
# when type is number, range is required
range: '[0,65535]'
required: true
defaultValue: 1157
placeholder: 'Please input port'
- field: ssl
name:
zh-CN: 启动SSL
en-US: SSL
# type-param field type(boolean mapping the html switch tag)
type: boolean
required: false
- field: contentType
name:
zh-CN: Content-Type
en-US: Content-Type
type: text
placeholder: 'Request Body Type'
required: false
- field: payload
name:
zh-CN: 请求BODY
en-US: BODY
type: textarea
placeholder: 'Available When POST PUT'
required: false
# collect metrics config list
metrics:
# metrics - auth
- name: auth
# metrics scheduling priority(0->127)->(high->low), metrics with the same priority will be scheduled in parallel
# priority 0's metrics is availability metrics, it will be scheduled first, only availability metrics collect success will the scheduling continue
priority: 0
# collect metrics content
fields:
# field-metric name, type-metric type(0-number,1-string), unit-metric unit('%','ms','MB'), label-whether it is a metrics label field
- field: token
type: 1
- field: refreshToken
type: 1
# the protocol used for monitoring, eg: sql, ssh, http, telnet, wmi, snmp, sdk
protocol: http
# the config content when protocol is http
http:
# http host: ipv4 ipv6 domain
host: ^_^host^_^
# http port
port: ^_^port^_^
# http url
url: /api/account/auth/form
# http method: GET POST PUT DELETE PATCH
method: POST
# if enabled https
ssl: ^_^ssl^_^
payload: ^_^payload^_^
# http request header content
headers:
content-type: ^_^contentType^_^
^_^headers^_^: ^_^headers^_^
# http request params
params:
^_^params^_^: ^_^params^_^
# http response data parse type: default-hertzbeat rule, jsonpath-jsonpath script, website-for website monitoring, prometheus-prometheus exporter rule
parseType: jsonPath
parseScript: '$.data'
---
- name: summary
priority: 1
fields:
- field: app
type: 1
label: true
- field: category
type: 1
- field: status
type: 0
- field: size
type: 0
- field: availableSize
type: 0
protocol: http
http:
host: ^_^host^_^
port: ^_^port^_^
url: /api/summary
method: GET
ssl: ^_^ssl^_^
authorization:
type: Bearer Token
# ^o^xxx^o^ ^o^ substitution represents the value of the acquisition metric xxx of the previous priority
bearerTokenToken: ^o^token^o^
parseType: jsonPath
parseScript: '$.data.apps.*'
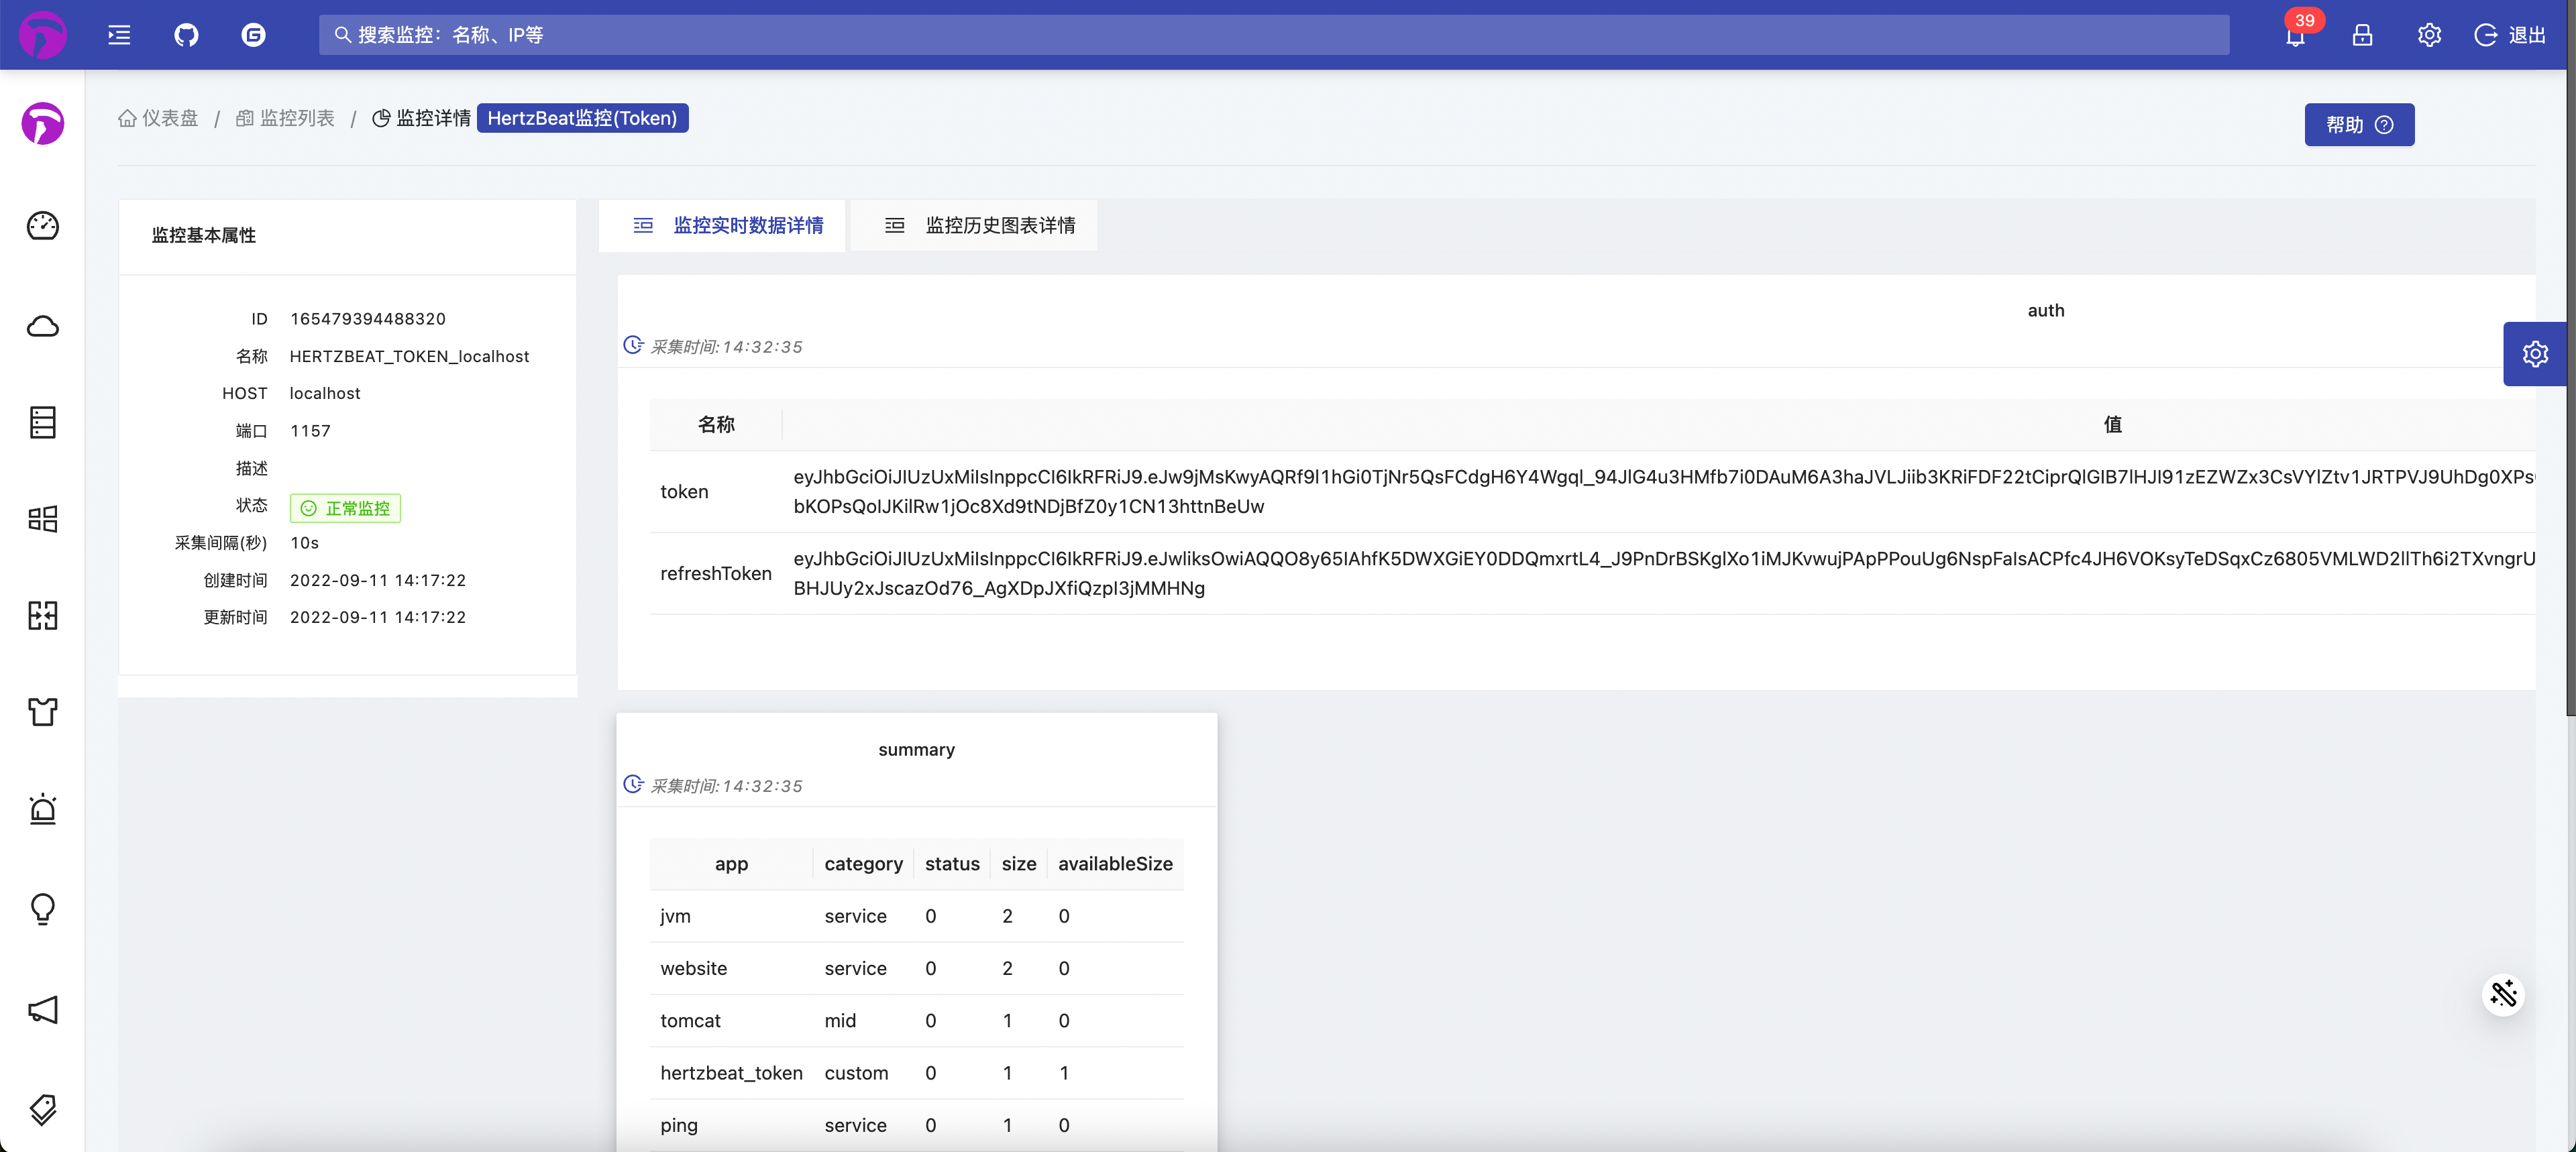
After the configuration is complete, save and apply, and check the monitoring details page
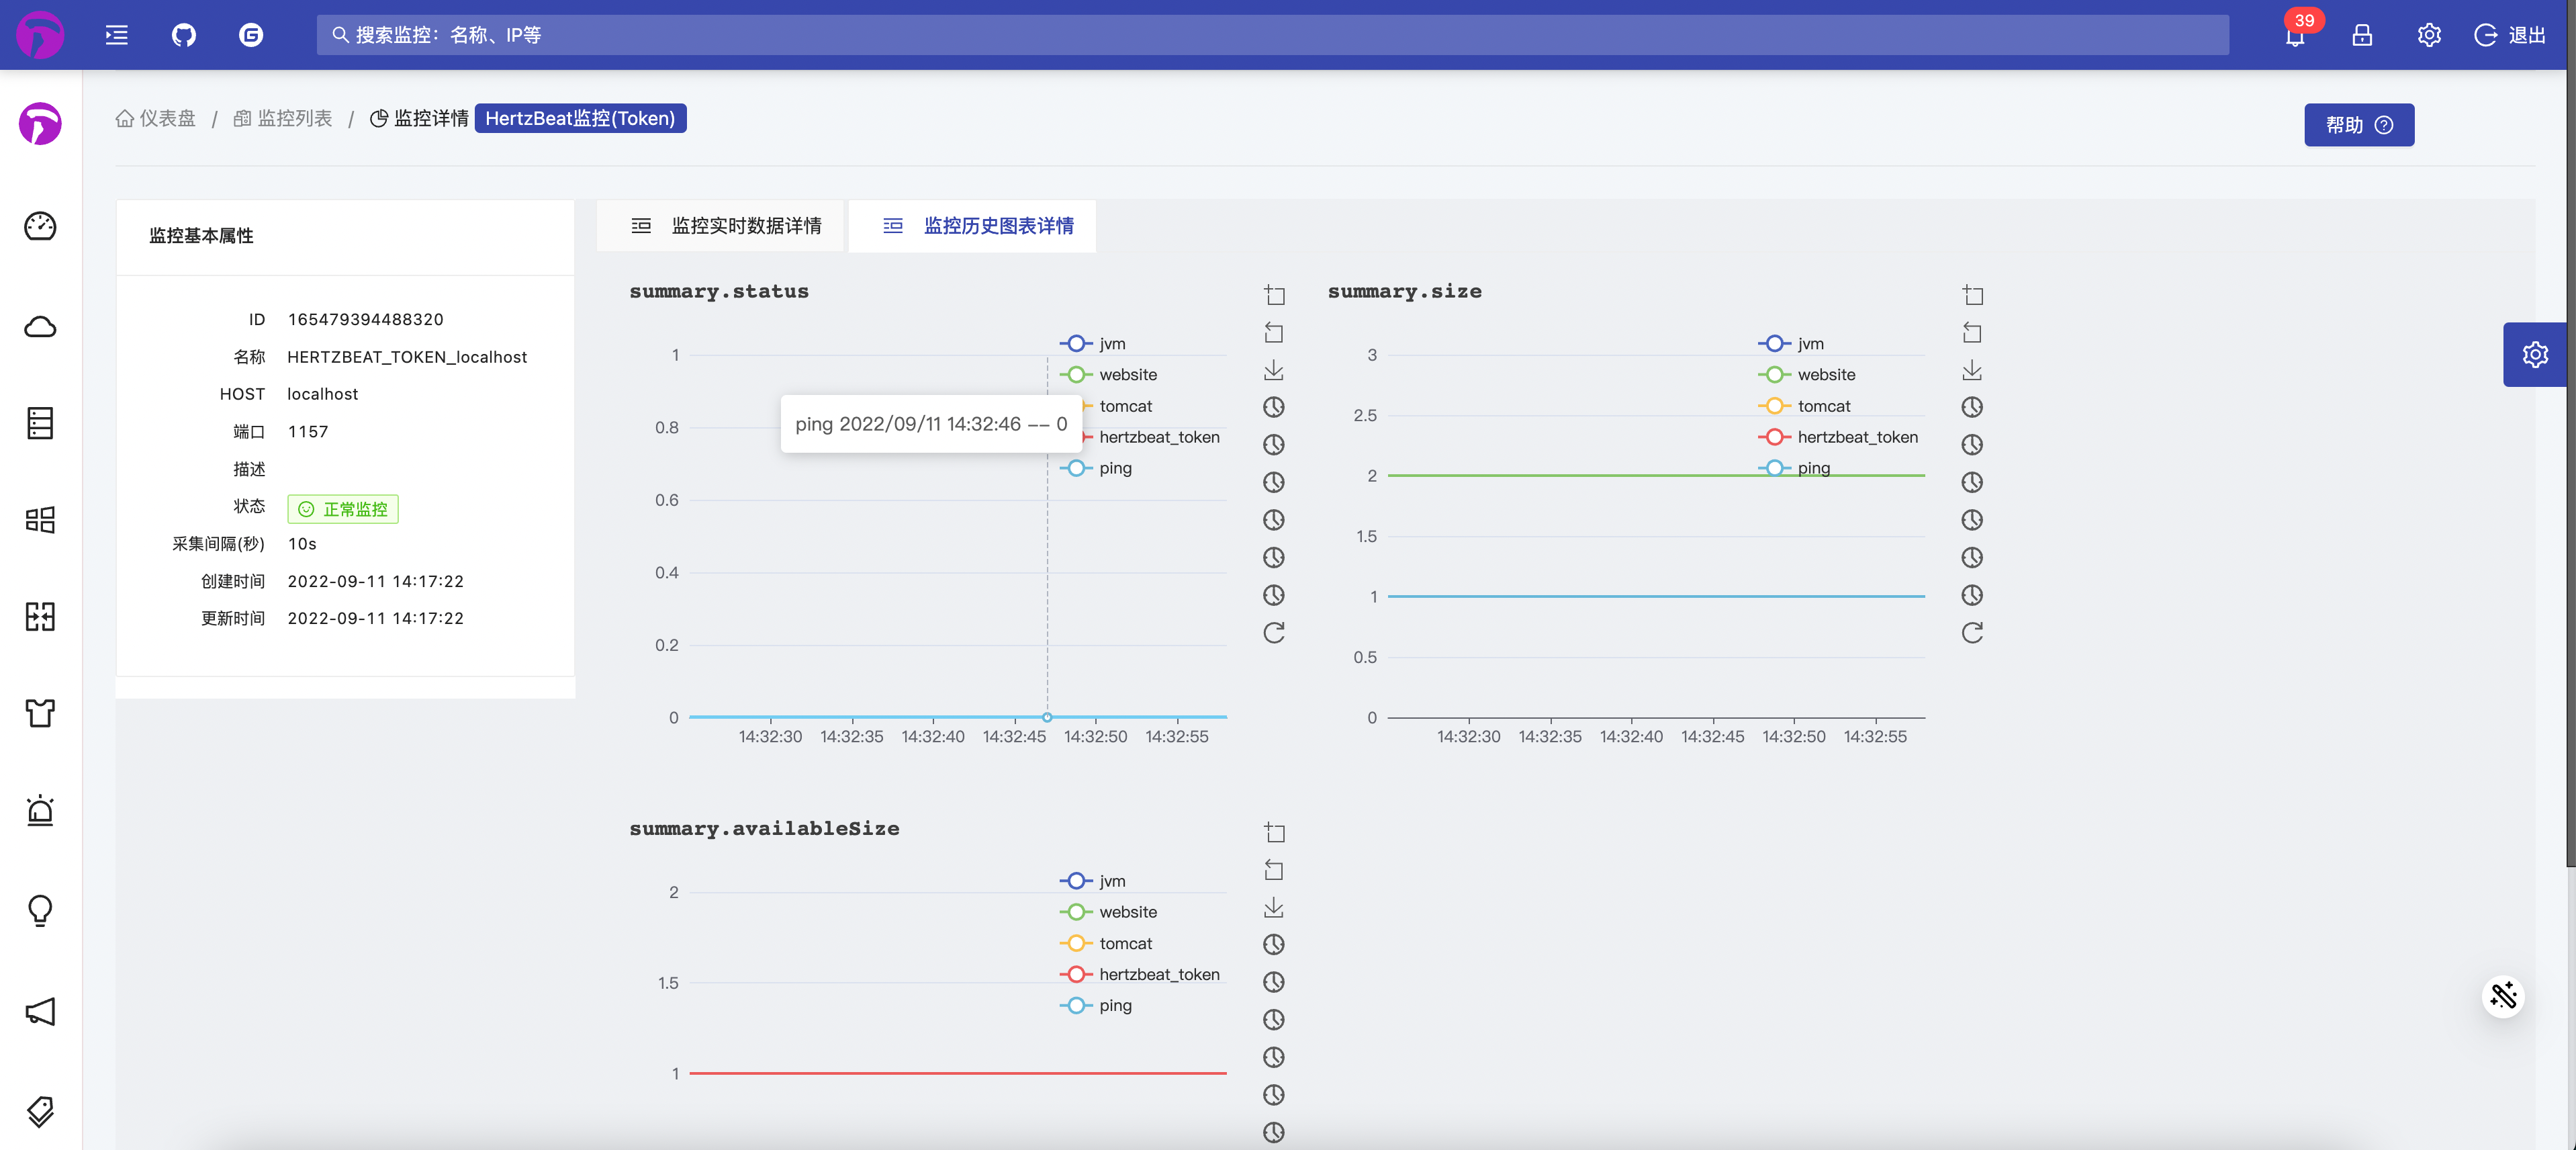
Set threshold alarm notification
Next, we can set the threshold normally. After the alarm is triggered, we can view it in the alarm center, add a new recipient, set alarm notification, etc. Have Fun!!!
over
This is the end of the practice of custom monitoring of the HTTP protocol. The HTTP protocol also has other parameters such as headers and params. We can define it like postman, and the playability is also very high!
If you think hertzbeat is a good open source project, please star us on GitHub Gitee, thank you very much.