自定义适配一款基于HTTP协议的新监控类型
通过此教程我们一步一步描述如何在 Apache HertzBeat™ 系统下自定义新增适配一款基于 http 协议的监控类型。
阅读此教程前我们希望您已经从自定义监控和http协议自定义了解熟悉了怎么自定义类型,指标,协议等。
HTTP协议解析通用响应结构体,获取指标数据
很多场景我们需要对提供的 HTTP API 接口进行监控,获取接口返回的指标值。这篇文章我们通过http自定义协议来解析我们常见的http接口响应结构,获取返回体中的字段作为指标数据。
{
  "code": 200,
  "msg": "success",
  "data": {}
}
如上,通常我们的后台API接口会设计这这样一个通用返回。hertzbeat系统的后台也是如此,我们今天就用hertzbeat的 API 做样例,新增适配一款新的监控类型 hertzbeat,监控采集它的系统摘要统计API
http://localhost:1157/api/summary, 其响应数据为:
{
  "msg": null,
  "code": 0,
  "data": {
    "apps": [
      {
        "category": "service",
        "app": "jvm",
        "status": 0,
        "size": 2,
        "availableSize": 0,
        "unManageSize": 2,
        "unAvailableSize": 0,
        "unReachableSize": 0
      },
      {
        "category": "service",
        "app": "website",
        "status": 0,
        "size": 2,
        "availableSize": 0,
        "unManageSize": 2,
        "unAvailableSize": 0,
        "unReachableSize": 0
      }
    ]
  }
}
我们这次获取其app下的 category,app,status,size,availableSize等指标数据。
新增配置监控模板YML
HertzBeat页面 -> 监控模板菜单 -> 新增监控类型 -> 配置自定义监控模板YML
定义我们在页面上需要输入哪些参数,一般的HTTP协议参数主要有ip, port, headers, params, uri, 账户密码等,我们直接复用 api监控模板 里面的参数定义内容,删除其中的我们不需要输入的uri参数和keyword关键字等参数即可。
定义采集类型是啥,需要用哪种协议采集方式,采集的指标是啥,协议的配置参数等。我们直接复用 api监控模板 里面的定义内容,修改为我们当前的监控类型hertzbeat配置参数即可,如下:注意⚠️我们这次获取接口响应数据中的category,app,status,size,availableSize等字段作为指标数据。
# The monitoring type category:service-application service monitoring db-database monitoring custom-custom monitoring os-operating system monitoring
# 监控类型所属类别:service-应用服务 program-应用程序 db-数据库 custom-自定义 os-操作系统 bigdata-大数据 mid-中间件 webserver-web服务器 cache-缓存 cn-云原生 network-网络监控等等
category: custom
# The monitoring type eg: linux windows tomcat mysql aws...
# 监控类型 eg: linux windows tomcat mysql aws...
app: hertzbeat
# The monitoring i18n name
# 监控类型国际化名称
name:
zh-CN: HertzBeat监控系统
en-US: HertzBeat Monitor
# The description and help of this monitoring type
help:
zh-CN: HertzBeat 对 HertzBeat 监控系统的通用指标进行测量监控。`<br>`您可以点击 “`<i>`新建 HertzBeat监控系统`</i>`” 并进行配置,或者选择“`<i>`更多操作`</i>`”,导入已有配置。
en-US: HertzBeat monitors HertzBeat Monitor through general performance metric. You could click the "`<i>`New HertzBeat Monitor`</i>`" button and proceed with the configuration or import an existing setup through the "`<i>`More Actions`</i>`" menu.
zh-TW: HertzBeat對HertzBeat監控系統的通用名額進行量測監控。`<br>`您可以點擊“`<i>`新建HertzBeat監控系統`</i>`”並進行配寘,或者選擇“`<i>`更多操作`</i>`”,導入已有配寘。
helpLink:
zh-CN: https://hertzbeat.apache.org/zh-cn/docs/help/hertzbeat
en-US: https://hertzbeat.apache.org/docs/help/hertzbeat
# Input params define for monitoring(render web ui by the definition)
# 监��控所需输入参数定义(根据定义渲染页面UI)
params:
# field-param field key
# field-字段名称标识符
- field: host
# name-param field display i18n name
# name-参数字段显示名称
name:
zh-CN: 主机Host
en-US: Host
# type-param field type(most mapping the html input type)
# type-字段类型,样式(大部分映射input标签type属性)
type: host
# required-true or false
# 是否是必输项 true-必填 false-可选
required: true
# field-param field key
# field-变量字段标识符
- field: port
# name-param field display i18n name
# name-参数字段显示名称
name:
zh-CN: 端口
en-US: Port
# type-param field type(most mapping the html input type)
# type-字段类型,样式(大部分映射input标签type属性)
type: number
# when type is number, range is required
# 当type为number时,用range表示范围
range: '[0,65535]'
# required-true or false
# required-是否是必输项 true-必填 false-可选
required: true
# default value
# 端口默认值
defaultValue: 1157
- field: ssl
name:
zh-CN: 启用HTTPS
en-US: HTTPS
type: boolean
required: true
- field: timeout
name:
zh-CN: 超时时间(ms)
en-US: Timeout(ms)
type: number
required: false
hide: true
- field: authType
name:
zh-CN: 认证方式
en-US: Auth Type
type: radio
required: false
hide: true
options:
- label: Basic Auth
value: Basic Auth
- label: Digest Auth
value: Digest Auth
- field: username
name:
zh-CN: 用户名
en-US: Username
type: text
limit: 50
required: false
hide: true
- field: password
name:
zh-CN: 密码
en-US: Password
type: password
required: false
hide: true
metrics:
# the first metrics summary
# attention: Built-in monitoring metrics contains (responseTime - Response time)
- name: summary
# metrics scheduling priority(0->127)->(high->low), metrics with the same priority will be scheduled in parallel
# priority 0's metrics is availability metrics, it will be scheduled first, only availability metrics collect success will the scheduling continue
# 指标调度优先级(0-127)越小优先级越高,优先级低的指标会等优先级高的指标采集完成后才会被调度,相同优先级的指标会并行调度采集
# 优先级为0的指标为可用性指标,即它会被首先调度,采集成功才会继续调度其它指标,采集失败则中断调度
priority: 0
# collect metrics content
# 具体监控指标列表
fields:
# metrics content contains field-metric name, type-metric type:0-number,1-string, label-if is metrics label, unit-metric unit('%','ms','MB')
# 指标信息 包括 field名称 type字段类型:0-number数字,1-string字符串 label是否为标签 unit:指标单位
- field: app
type: 1
label: true
- field: category
type: 1
- field: status
type: 0
- field: size
type: 0
- field: availableSize
type: 0
# the protocol used for monitoring, eg: sql, ssh, http, telnet, wmi, snmp, sdk, we use HTTP protocol here
# 监控采集使用协议 eg: sql, ssh, http, telnet, wmi, snmp, sdk, 我们这里使用HTTP协议
protocol: http
# the config content when protocol is http
# 当protocol为http协议时具体的采集配置
http:
# http host: ipv4 ipv6 domain
# 主机host: ipv4 ipv6 域名
host: ^_^host^_^
# http port
# 端口
port: ^_^port^_^
# http url, we don't need to enter a parameter here, just set the fixed value to /api/summary
# url请求接口路径,我们这里不需要输入传参,写死为 /api/summary
url: /api/summary
timeout: ^_^timeout^_^
# http method: GET POST PUT DELETE PATCH, default fixed value is GET
# 请求方式 GET POST PUT DELETE PATCH,写死为 GET
method: GET
# if enabled https, default value is false
# 是否启用ssl/tls,即是http还是https,默认false
ssl: ^_^ssl^_^
# http auth
# 认证
authorization:
# http auth type: Basic Auth, Digest Auth, Bearer Token
# 认证方式: Basic Auth, Digest Auth, Bearer Token
type: ^_^authType^_^
basicAuthUsername: ^_^username^_^
basicAuthPassword: ^_^password^_^
digestAuthUsername: ^_^username^_^
digestAuthPassword: ^_^password^_^
# http response data parse type: default-hertzbeat rule, jsonpath-jsonpath script, website-for website monitoring, we use jsonpath to parse response data here
# 响应数据解析方式: default-系统规则,jsonPath-jsonPath脚本,website-网站可用性指标监控,我们这里使用jsonpath来解析响应数据
parseType: jsonPath
parseScript: '$.data.apps.*'
点击保存并应用。我们可以看到系统页面的自定义监控菜单已经多了一个hertzbeat监控类型了。
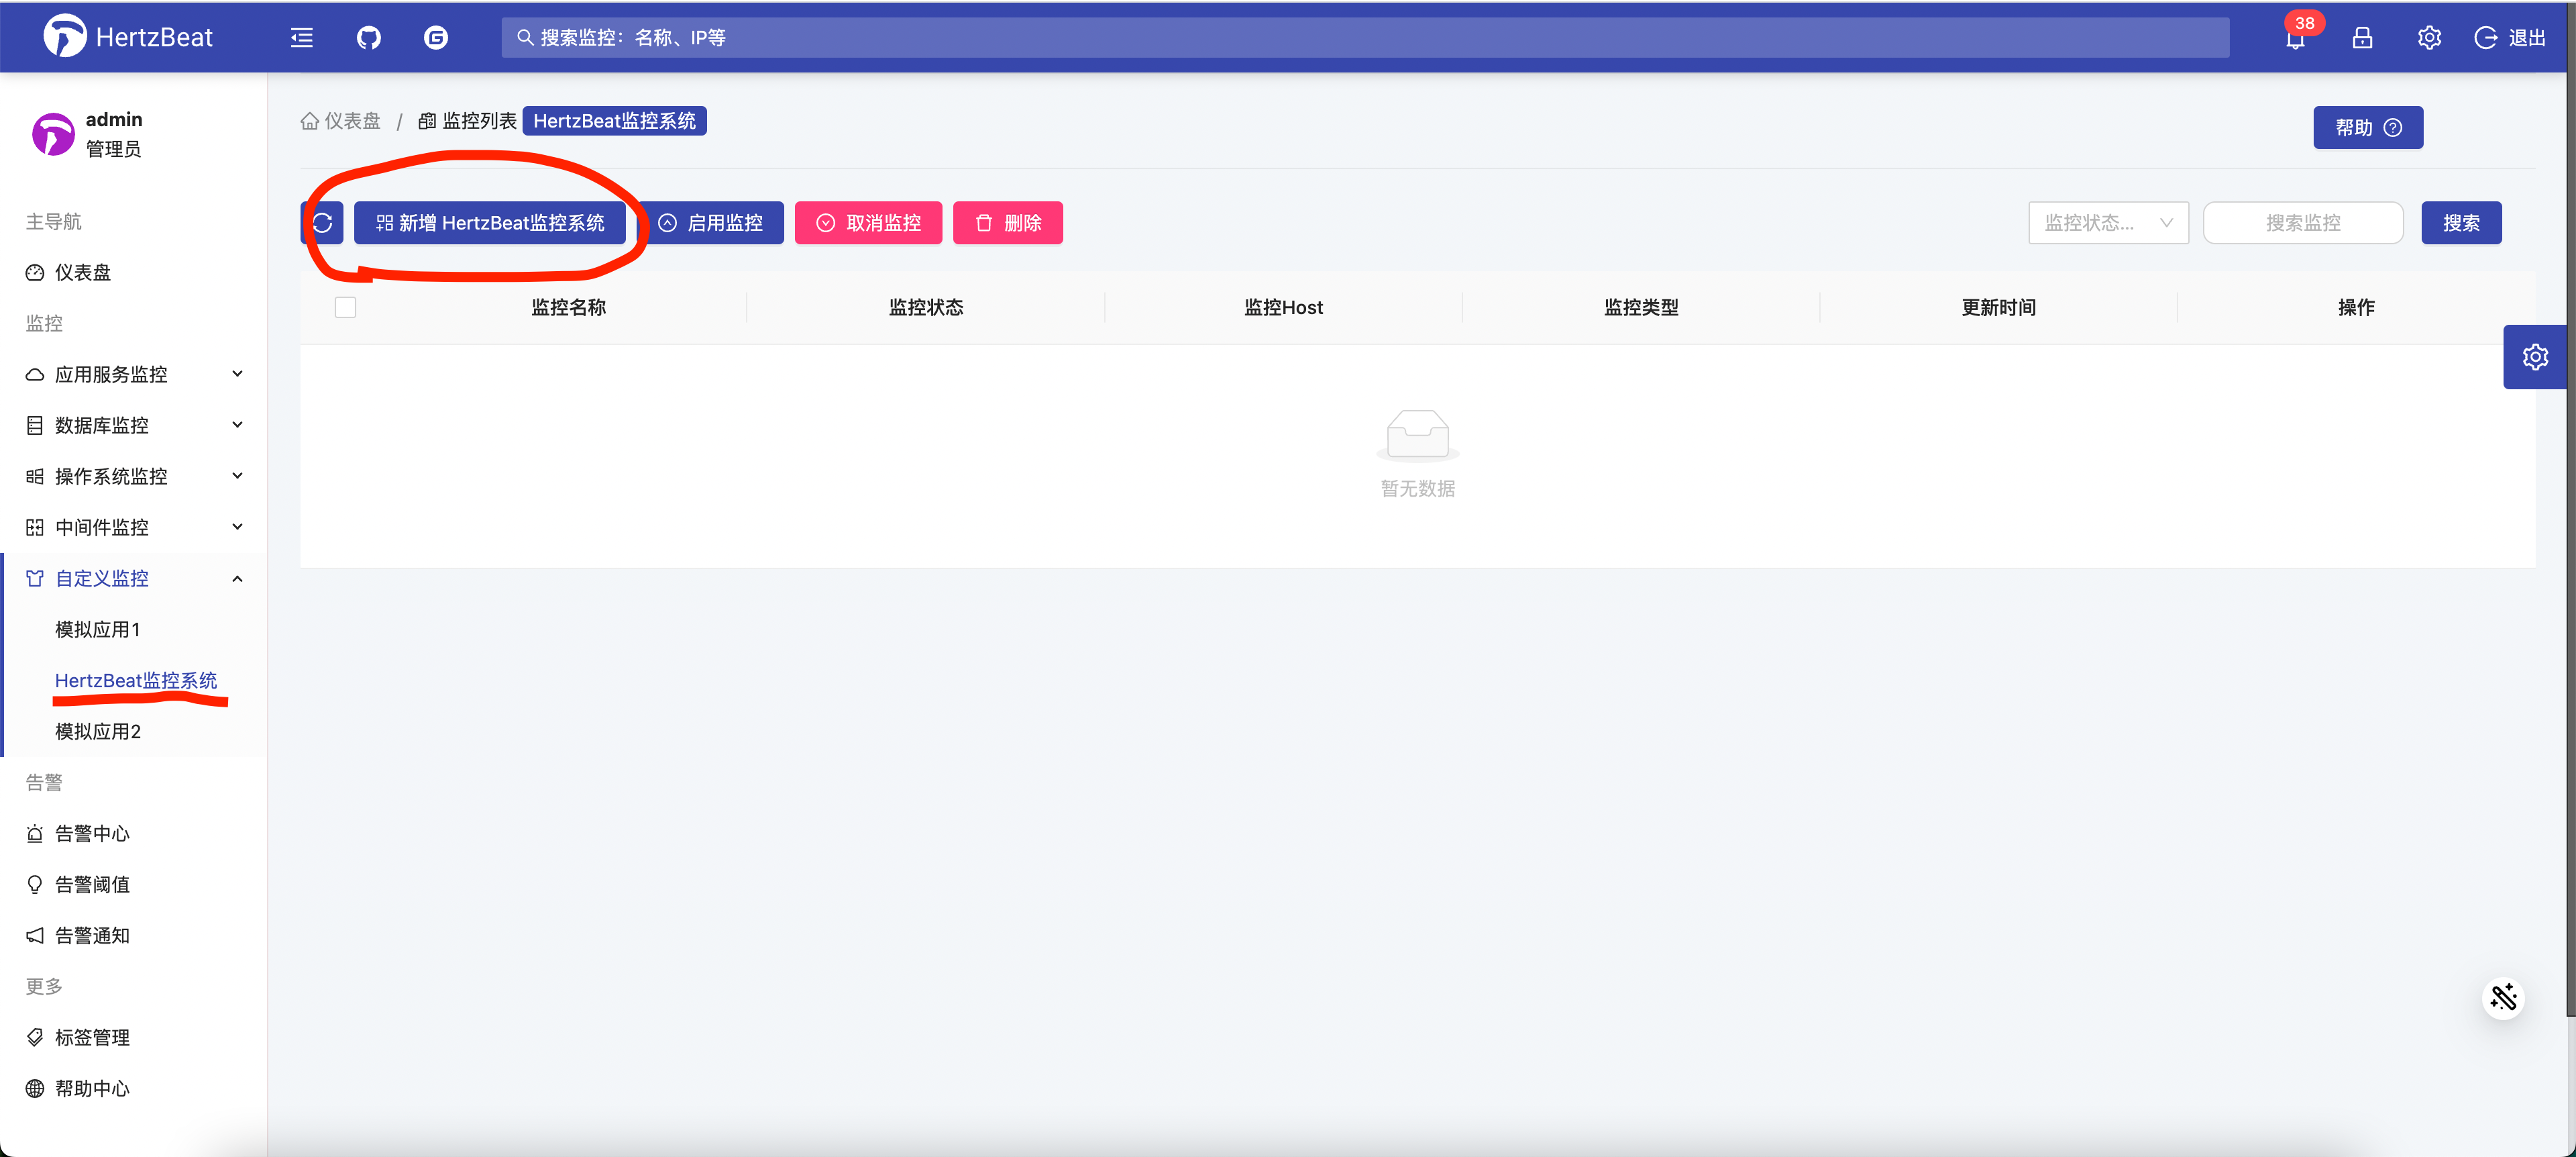
页面添加对hertzbeat监控类型的监控
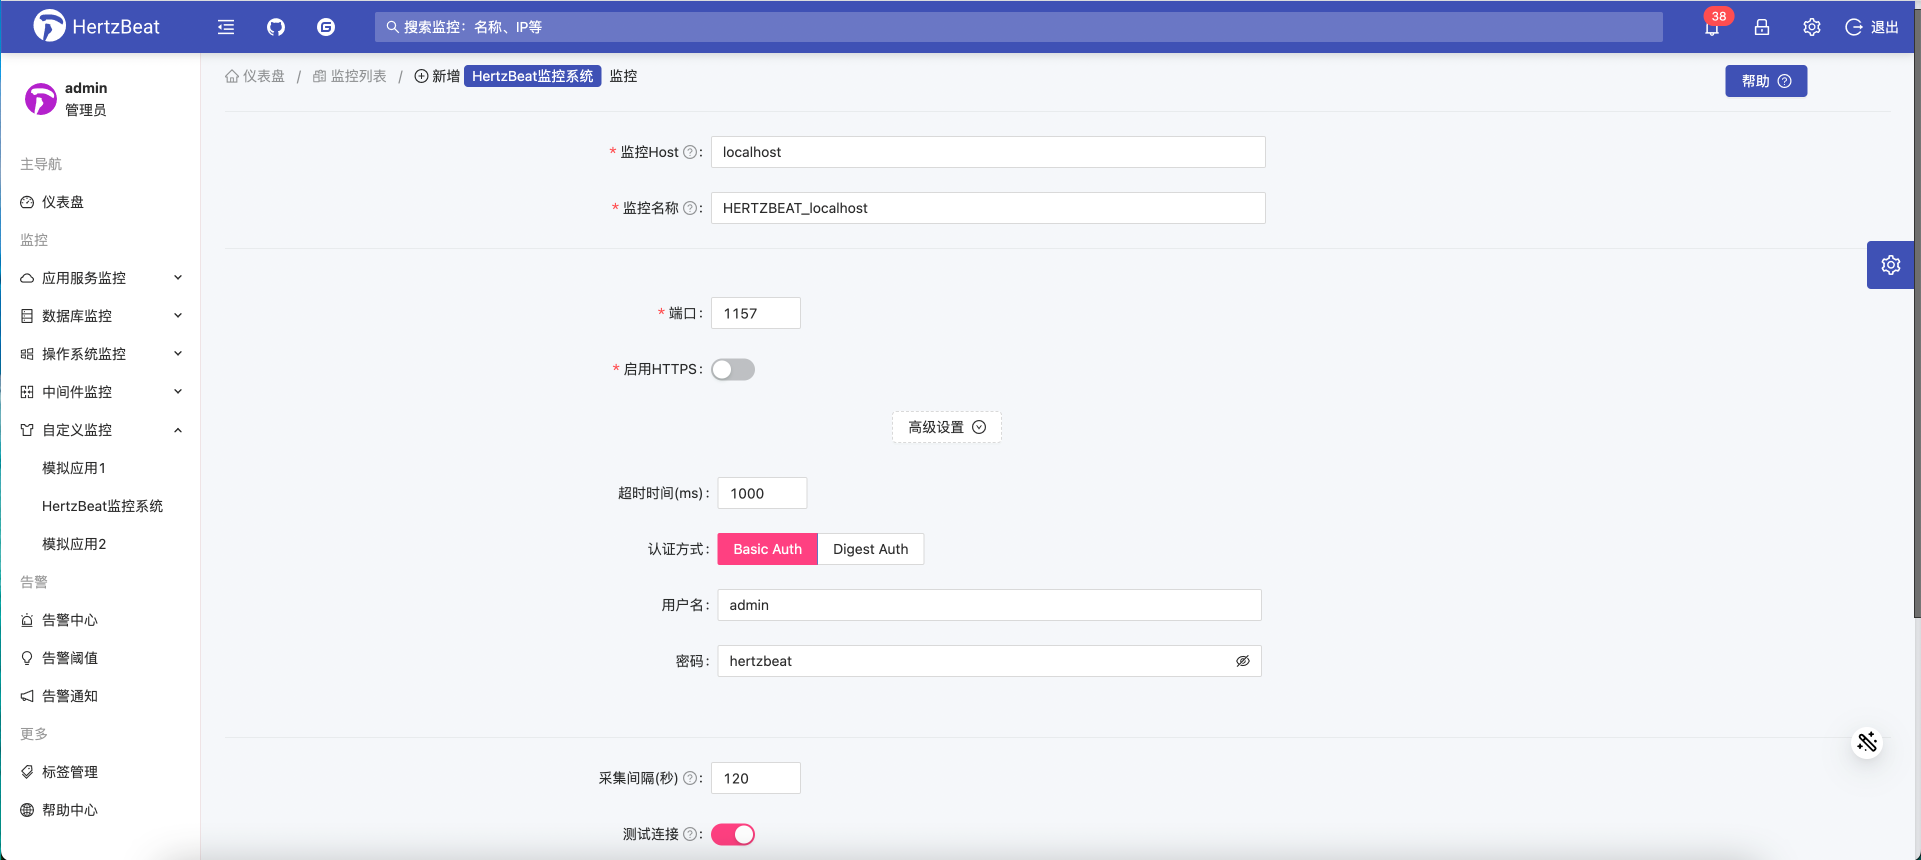
我们点击新增
HertzBeat监控系统,配置监控IP,端口,采集周期,高级设置里的账户密码等, 点击确定添加监控。
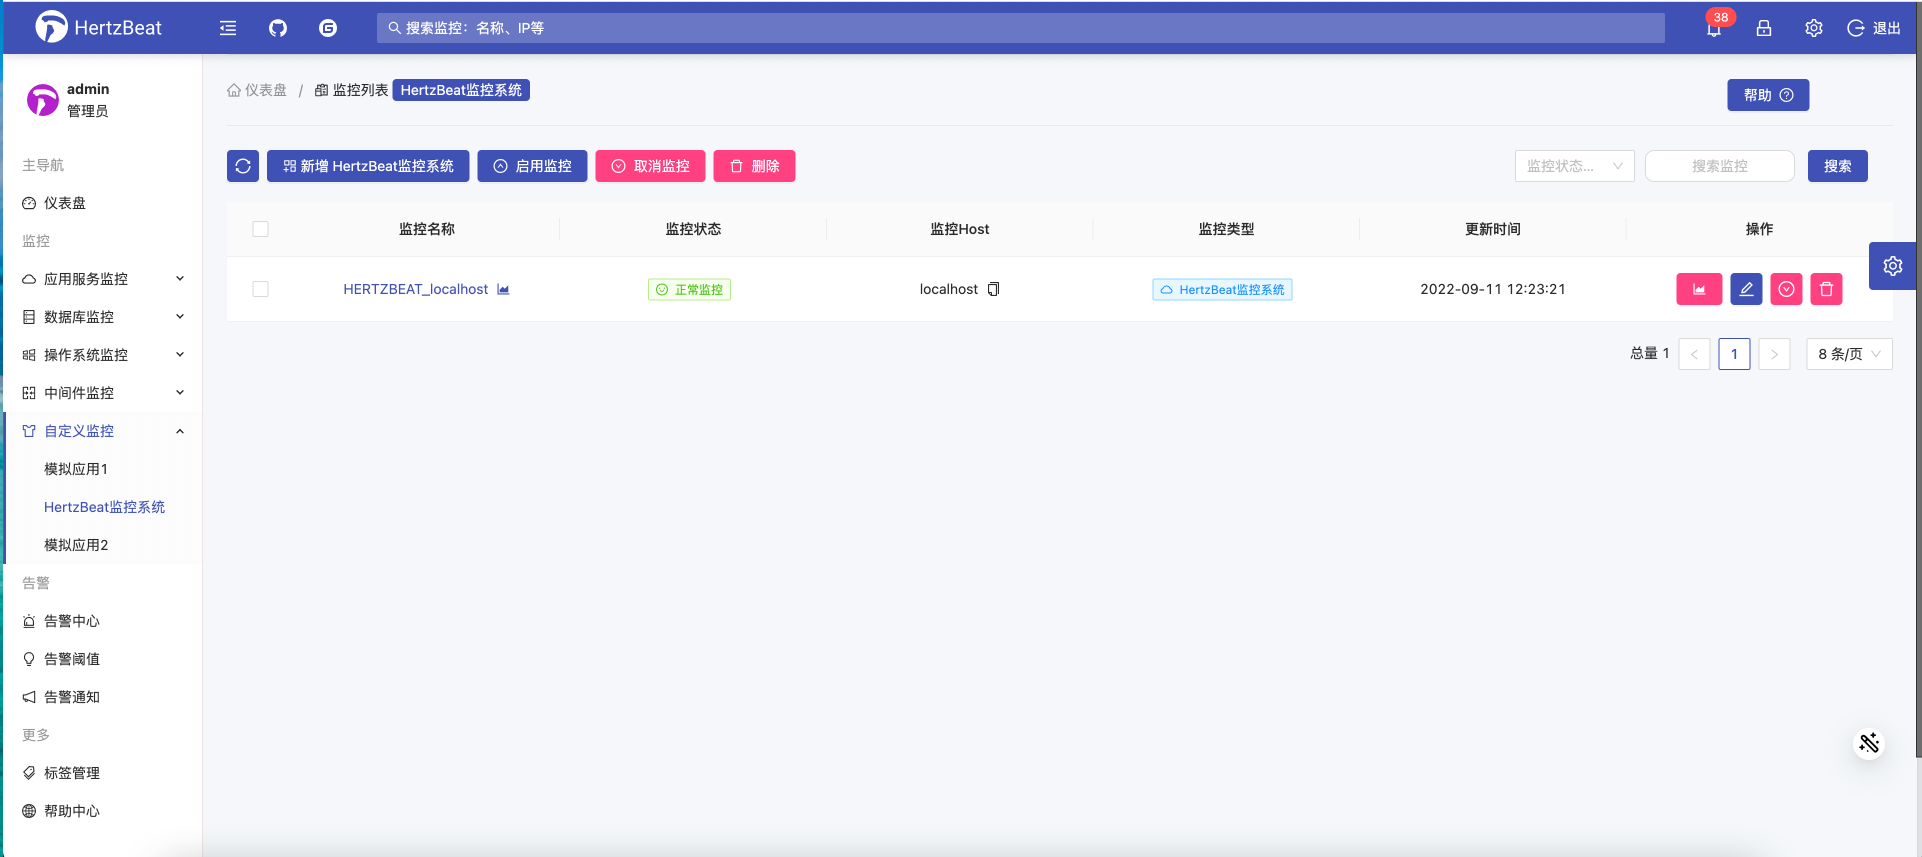
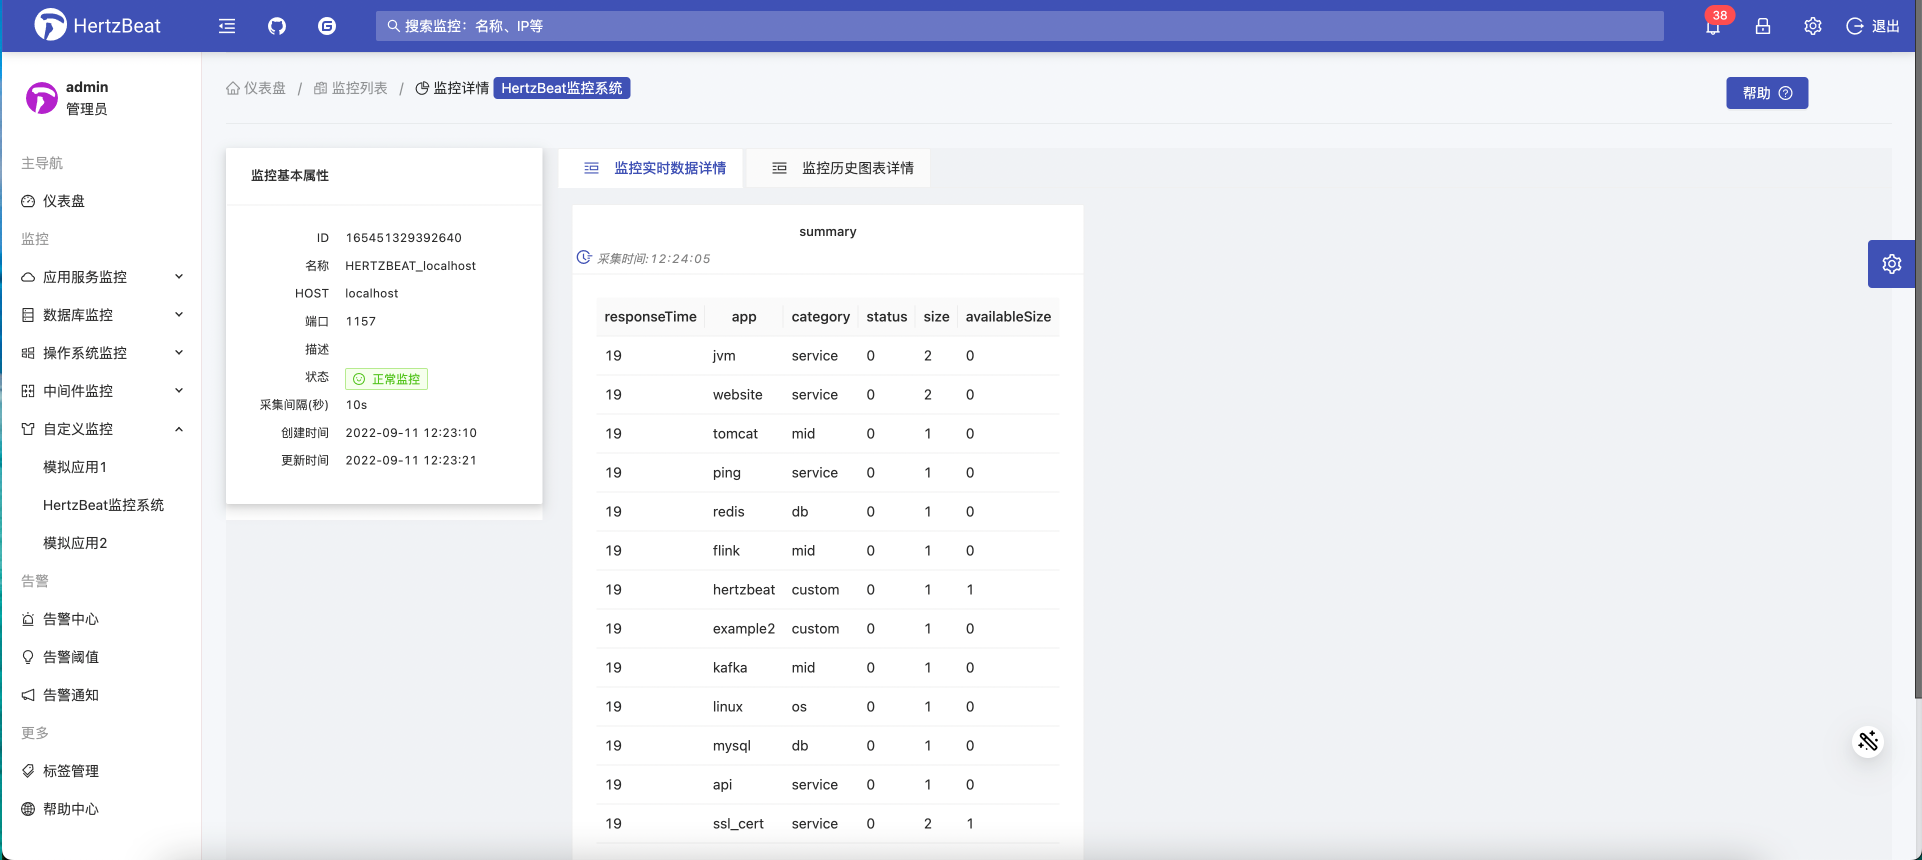
过一定时间(取决于采集周期)我们就可以在监控详情看到具体的指标数据和历史图表啦!
设置阈值告警通知
接下来我们就可以正常设置阈值,告警触发后可以在告警中心查看,也可以新增接收人,设置告警通知等,Have Fun!!!
完
HTTP协议的自定义监控的实践就到这里,HTTP协议还带其他参数 headers,params 等,我们可以像用postman一样去定义它,可玩性也非常高!