Becoming an Apache Committer is a recognition of my participation in open source
My open source journey
Speaking of open source, I came into contact with it at the beginning of my junior year. The scene at that time is still vivid in my mind.
In retrospect, my first official Github Pull Request was to remove a redundant Pom dependency for the Spring Cloud Alibaba project. I was very busy at the time, and after more than two hours of figuring it out, I finally submitted the first Pull Request successfully. I am very grateful to Cheng Pu, who introduced me to open source and took the crucial first step in participating in open source.
From the initial rush of using Git, to now git c -m XXX, as well as participating in various PR/Issue on Github. Looking back, I have so many thoughts. I think life is nothing more than this. Learn and explore -> use skillfully -> make achievements.
From my junior year to the present, I still maintain my passion for open source and participate in open source. To this day, I am already a committer on three projects.
Participate in the Apache Community
Apache Software Foundation (ASF) is an American non-profit organization that aims to support various open source software projects. ASF was originally formed by a group of developers of Apache HTTP Server and was officially established on March 25, 1999. As of 2021, its total membership is approximately 1,000. The name comes from a local Indian tribe in North America. This tribe is famous for its superb military literacy and superhuman endurance. In the second half of the 19th century, it resisted the invaders who invaded their territory. In order to show respect for this Indian tribe, the name of the tribe (Apache) is used as the server name. But when it comes to this naming, there is an interesting story circulating here. Because this server is based on the NCSA HTTPd server and is the product of continuous revision and patching through the efforts of everyone, it is nicknamed "A Patchy Server" (a patch server). Here, because "A Patchy" and "Apache" are homophones, it was finally officially named "Apache Server".
The above is an introduction to the Apache Software Foundation from Wikipedia.
The Apache Software Foundation was originally composed of developers who developed Apache HTTPd. Starting from the Apache HTTPd web server project, they created many excellent open source projects, attracting Common open source enthusiasts around the world participate in the maintenance and iteration of the project. Projects continue to be retired, and new projects are constantly being hatched, over and over again. Only then did the Apache Software Foundation become what it is today.

First contribution
The first contribution in the Apache community should be to delete a {@link} code link to the Dubbo project. I'm ashamed to say that Dubbo is the first open source project I participated in Apache, and there are only 6 submissions so far. In May, I came into contact with the Apache HertzBeat project through Rick, and started my Apache contribution from unit testing. road.
Get nominated and become a Committer
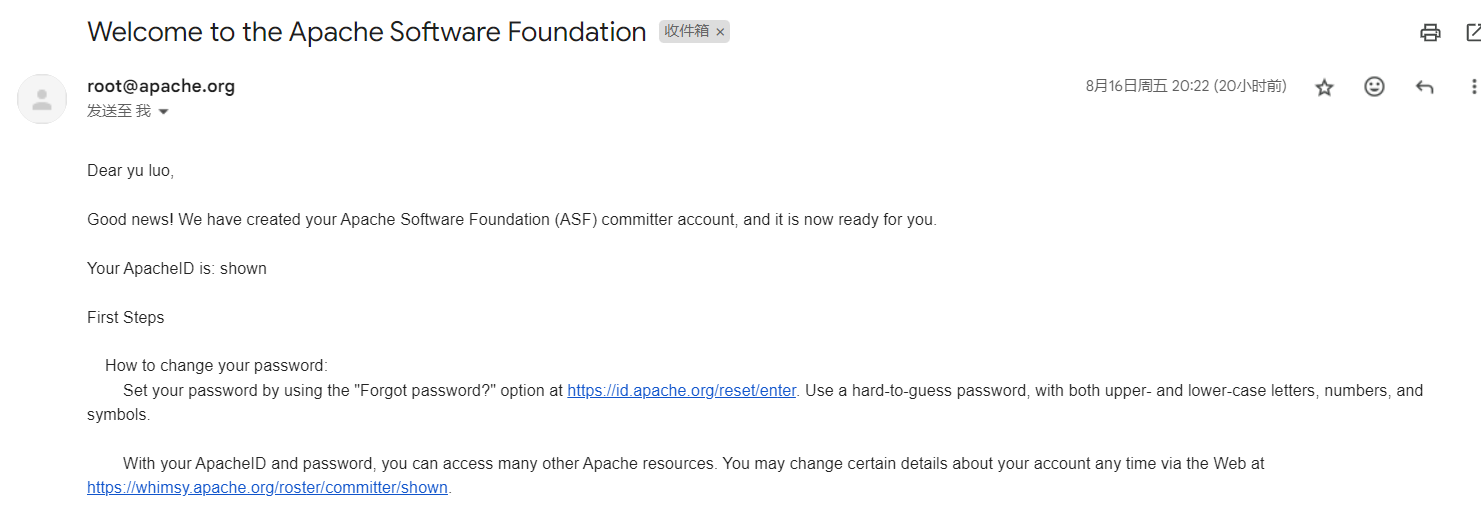
This nomination was recommended by PPMC Member Logic of Apache HertzBeat. Thanks to the Apache HertzBeat™ Team. I was successfully nominated to become a HertzBeat Committer and got my own Apache mailbox.

The meaning of Apache Committer
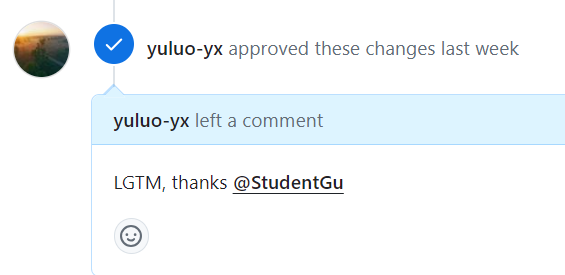
As the saying goes, the greater the ability, the greater the task. Becoming a project committer is not only a change of identity, but also an recognition and affirmation of one's own abilities. When reviewing the PR, my ‘LGTM’ is no longer a gray style, but has become blue (due to different personal Github themes, the execution color is also different). No need to wait for other Committer Approve CIs. It means that you have management rights over the project.

How to participate in open source
Anyone who wants to do something needs an opportunity and a guide. Among the many Apache projects, there are many people who pay attention to the project's Issue List. The one time that remains fresh in my memory is: one night after writing the unit test of a tool class, I discovered a small bug. What I thought at the time was that there was too much contextual information and it was not good to write it in a PR, so I opened an Issue to record the context. How small is this bug? It was so small that I just created the Issue. After submitting the unit test and the code to fix the bug together, I refreshed the PR List again and saw a PR Title to fix the bug.
In fact, there is no shortage of people paying attention to the project, but more of an opportunity! Opportunities to participate in projects.
The Apache Way
The Apache Way pursued by the Apache Community. The community is greater than the code. A good community is often more important than excellent code. The components of the community include developers, users, etc. Users are the first users of the project code. A healthy community status is when users discover problems, then report problems, and finally solve problems during use. A more likely scenario is that a user reports a problem, switches from being a user to a developer, and solves the problem. And continue to participate in the maintenance of community projects.
Paths to participate in open source
Open source is often pure, and the Apache Foundation exists to protect projects and developers.
Apache Community Identity
Before contributing to the community, it is important to understand the community's definition of identity, where a project's Committers are located, and how to become a Committer. The Apache community has a clear definition of [Contributor Identity](https://community.apache.org/contributor-ladder. html): [Contributor Identity](https://community.apache.org/contributor-ladder. html). The Apache community has a very clear definition of [contributor status](. html):
Project Committer Nomination Criteria
The conditions for a Project PPMC Team to nominate a Committer are different. Take Apache HertzBeat™ for example:
! Apache HertzBeat™ becoming committer
Each project has its own standards, and these standards are not set in stone and will be adjusted at each stage of the project.
How to Participate in Open Source
Next is the highlight of this section, how to participate in open source and get nominated as a Committer?
Open Source Events
Students, because of their special status, do not have the experience of developing large-scale projects and do not have the opportunity to cut their teeth in a production environment. Therefore, it is often difficult to get involved in open source and there is a lack of opportunities.
I think the best way to get involved in open source and get nominated is the Open Source Summer (OSPP) or Google Summer of Open Source (GSOC) events. After completing the topic in question, gradual familiarization with the project's features, code, and continued participation will result in a nomination. There is also no lack of students who are nominated to become project Committer directly after completing the topic.
The next step is to Improve your Coding ability, find the missing unit tests and code bugs in the project, and then submit PR to fix them. This is often difficult for students who are just starting out, and the Coding ability is often built up after optimizing the project code and understanding every change.
The ecosystem around a good projectis often crucial. A good documentation allows users/developers to quickly get started and participate in contributing. Multi-language extensions allow the project to be used in projects built in other languages, expanding the project's audience. A good Example repository allows users to discover more ways to use the project. Therefore, participating in the construction of the Example repository and writing and translating documentation is one of the ways to familiarize yourself with the project and get nominated.
Finally, I would like to say that getting nominated is something that just happens. You should not participate in open source just for the sake of getting nominated, and you should never forget your original intention.
Project communities tend to welcome contributions in all ways: be it code, documentation or sermons.
Random Thoughts
I'm writing this post to commemorate the special occasion of becoming an Apache HertzBeat™ Committer, and to motivate me to get involved in open source in the future. Keep up the enthusiasm, keep up the coding, and thank you for all the people who have helped me while I've been involved in open source. I wish HertzBeat the best of luck in its incubation and graduation to become a top Apache project! 🎉