SpringBoot Web Application Monitoring Practice
In the cloud-native era, monitoring and visualization of SpringBoot applications have become core components of O&M (Operations & Maintenance) systems. Real-time monitoring of application performance is crucial for ensuring system stability.
This article introduces an integrated solution using the HertzBeat monitoring system, covering metric collection, visualization, and alarm notifications. It demonstrates the complete operational procedure and monitoring practices.
What is HertzBeat
Apache HertzBeat is a real-time monitoring tool with powerful custom monitoring capabilities without Agent. Website monitoring, PING connectivity, port availability, database, operating system, middleware, API monitoring, threshold alarms, alarm notification (email, WeChat, Ding Ding Feishu).
github: https://github.com/apache/hertzbeat
Install HertzBeat
For production environments, it is recommended to deploy HertzBeat using PostgreSQL + VictoriaMetrics.
-
Deploy HertzBeat
Download the installation package
Download the
apache-hertzbeat-xxx-incubating-bin.tar.gzinstallation package corresponding to your system environment from the Download Page. Extract the package to a host directory, e.g.,/opt/hertzbeat.tar zxvf apache-hertzbeat-xxx-incubating-bin.tar.gz -
Quick Install PostgreSQL + VictoriaMetrics Services
Install PostgreSQL via Docker
docker run -d --name postgresql -p 5432:5432 -v "$PWD/postgresql:/var/lib/postgresql/data" -e POSTGRES_USER=root -e POSTGRES_PASSWORD=123456 -e TZ=Asia/Shanghai postgres:15Install VictoriaMetrics via Docker
docker run -d -p 8428:8428 -v "$PWD/victoria-metrics-data:/victoria-metrics-data" --name victoria-metrics victoriametrics/victoria-metrics:v1.95.1 -
Modify HertzBeat's Configuration File
Switch the metadata storage data source
Modify the
hertzbeat/config/application.ymlconfiguration file to use the PostgreSQL service.noteFor PostgreSQL configuration details, please refer to the documentation: Meta Store PostgreSQL (Recommended)
Configure the time-series database for metric storage
Modify the
hertzbeat/config/application.ymlconfiguration file to enable the VictoriaMetrics service for storing metrics.noteFor VictoriaMetrics configuration details, please refer to the documentation: Metrics Store VictoriaMetrics (Recommended)
-
Start HertzBeat
Use the
startup.shscript located in thebindirectory of the extracted installation folder. For Windows environments, usestartup.bat.After successful startup, access
http://localhost:1157in your browser to begin. The default username and password areadmin/hertzbeat../startup.sh
SpringBoot Application Configuration
-
Enable Actuator Configuration
Add the following dependencies to project's
pom.xml:<dependency>
<groupId>org.springframework.boot</groupId>
<artifactId>spring-boot-starter-actuator</artifactId>
</dependency>
<dependency>
<groupId>io.micrometer</groupId>
<artifactId>micrometer-registry-prometheus</artifactId>
</dependency>Configure
application.ymlto expose endpoints:management:
endpoints:
web:
exposure:
include: '*'
enabled-by-default: true
metrics:
export:
prometheus:
enabled: trueNote: If your project also introduces authentication related dependencies, such as springboot security, the interfaces exposed by SpringBoot Actor may be intercepted. In this case, you need to manually release these interfaces. Taking springboot security as an example, you should add the following code to the Security Configuration class:
public class SecurityConfig extends WebSecurityConfigurerAdapter{
    @Override
    protected void configure(HttpSecurity httpSecurity) throws Exception{
        httpSecurity
                // Configure the interfaces to be opened
                .antMatchers("/actuator/**").permitAll()
                .antMatchers("/metrics/**").permitAll()
                .antMatchers("/trace").permitAll()
                .antMatchers("/heapdump").permitAll()
                // ...
    }
} -
Verify Endpoints
After starting SpringBoot application, request the following URL:
http://<your-host>:<port>/actuator`: Verify the enabled endpoints.http://<your-host>:<port>/actuator/prometheus`: Should return metric data in Prometheus format.
Monitor SpringBoot Application
-
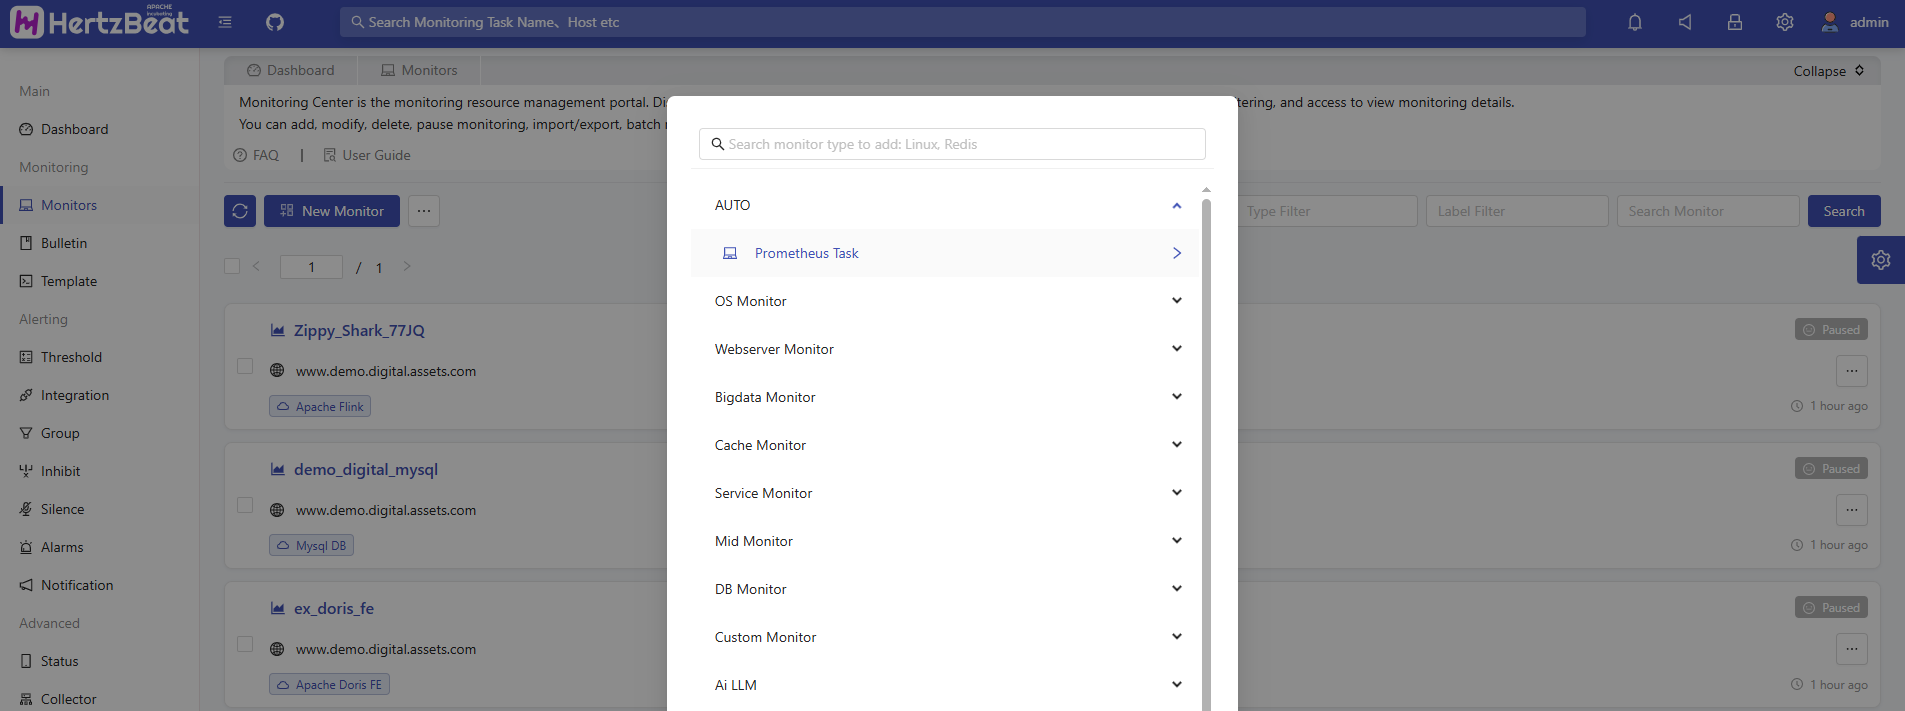
Add AUTO Monitor
HertzBeat Page -> Monitors -> New Monitor -> AUTO -> Prometheus Task
-
Fill in Key Parameters
Target Host: The server address of the SpringBoot application (without the protocol prefix like
http://orhttps://).Port: The application service port (e.g.,
8080).Endpoint Path:
/actuator/prometheusTasks can be managed using label classification, such as adding Bind Labels like
env=test.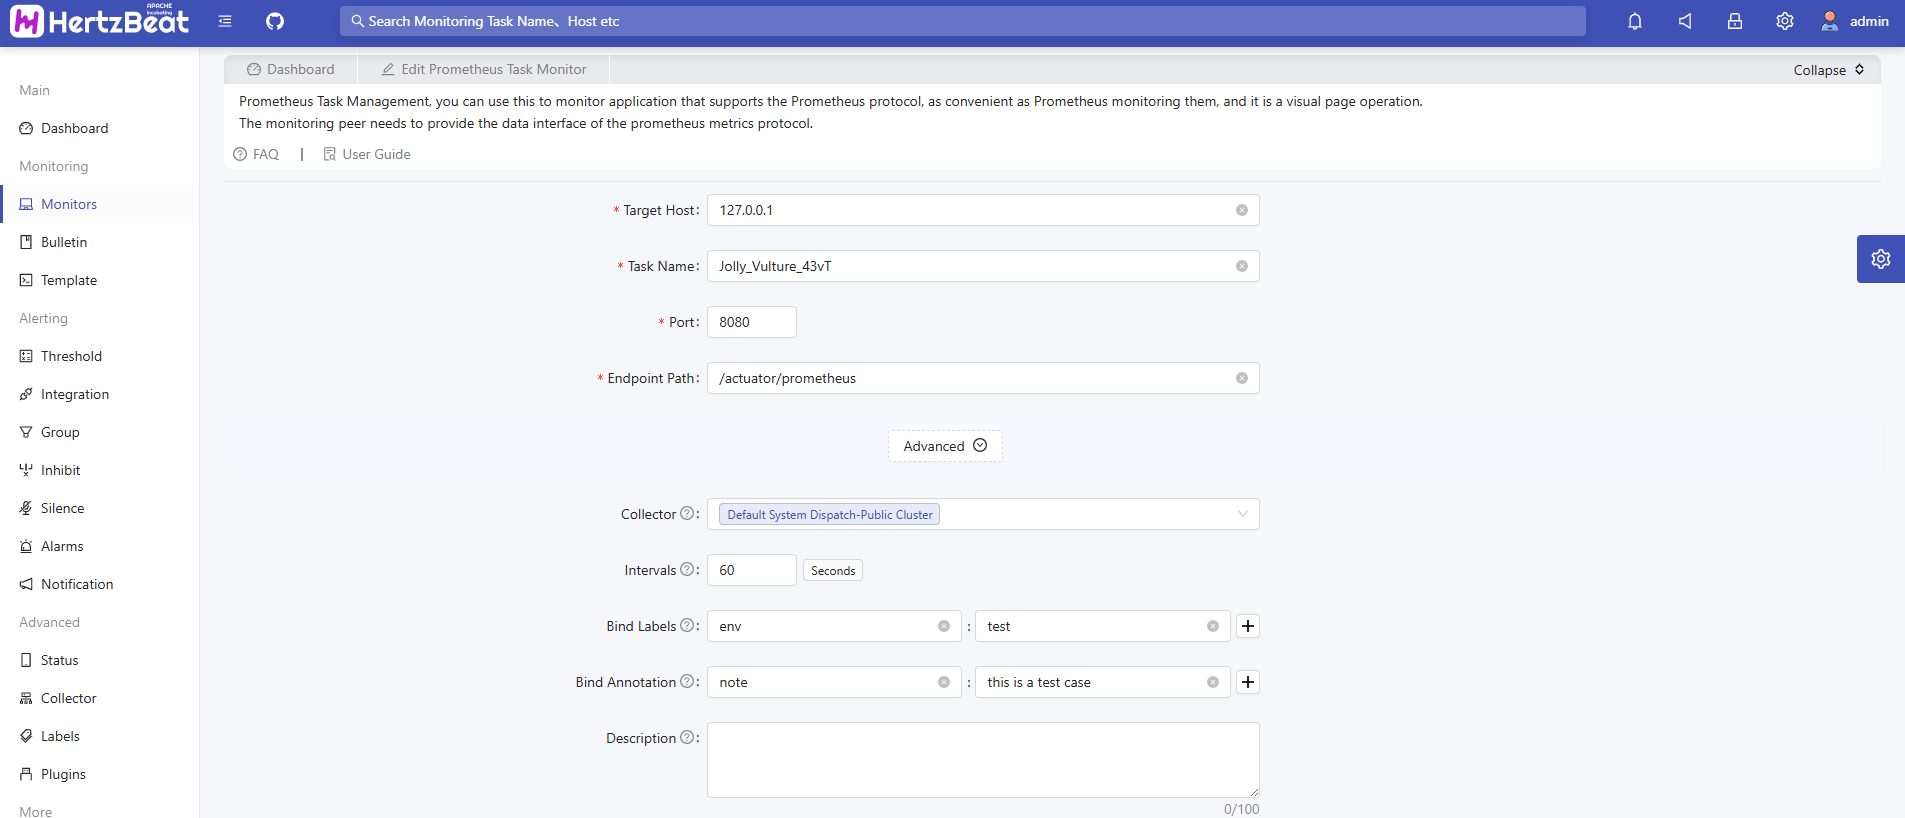
-
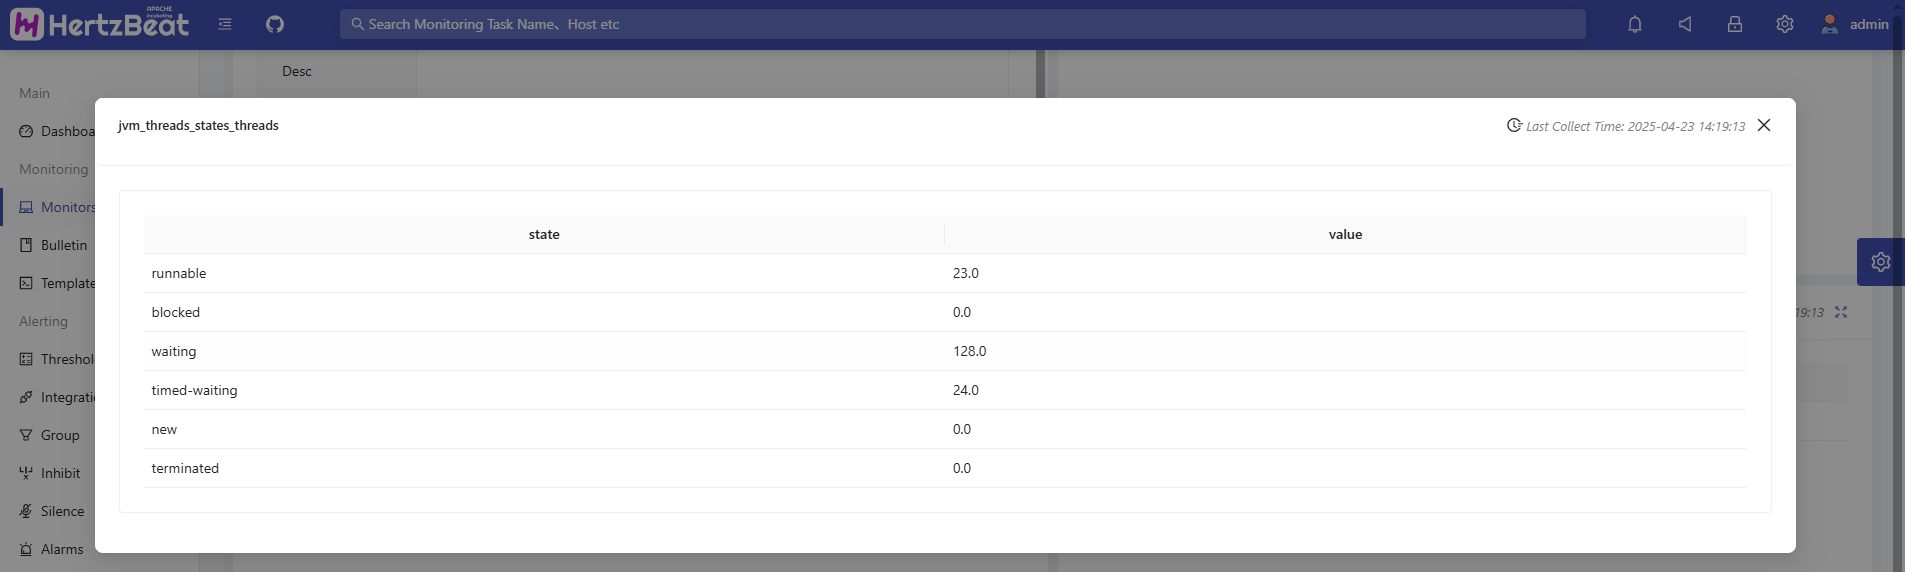
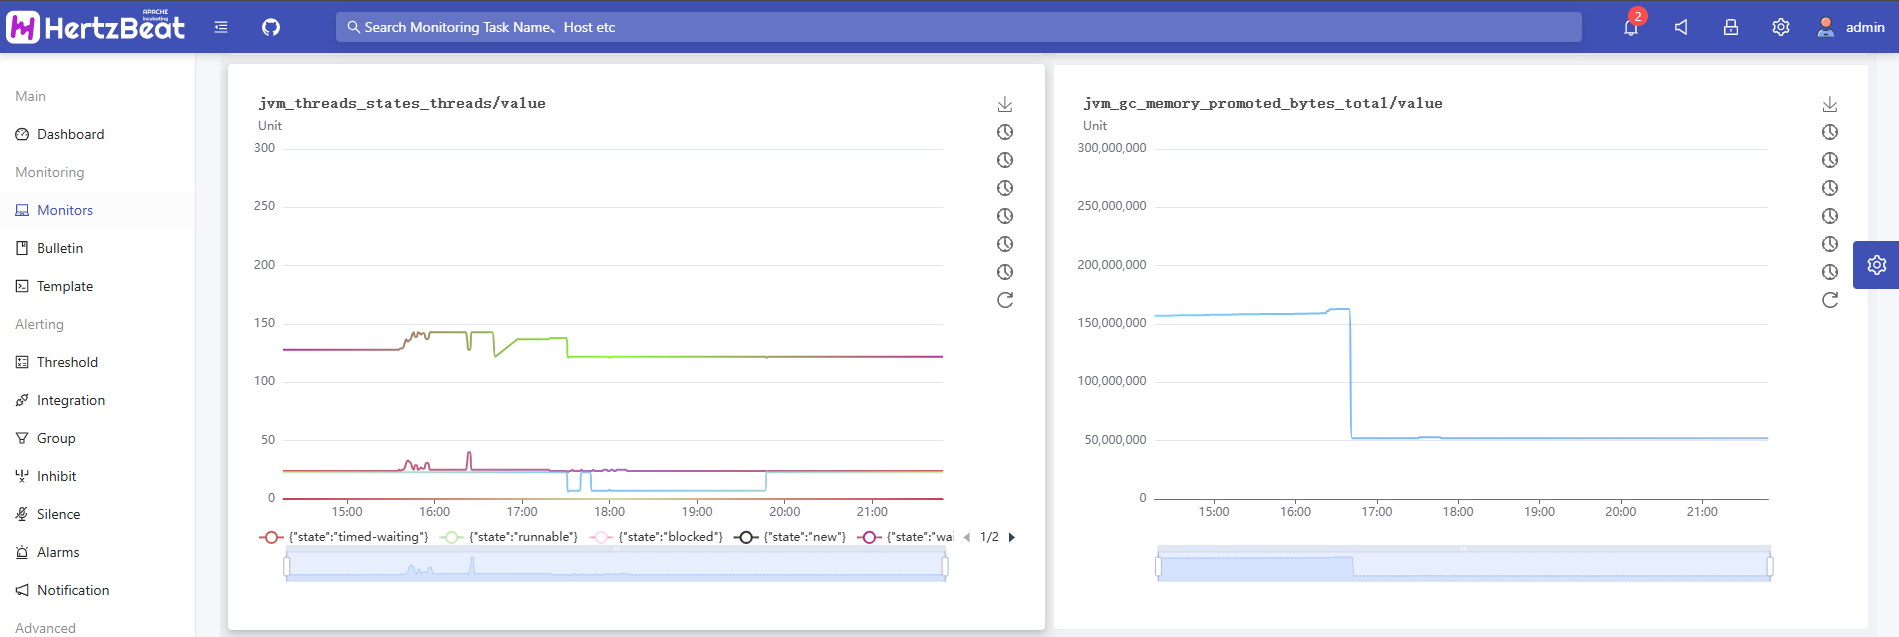
View Detected Metric Data
Click on the newly created monitor to view detailed metric data, historical charts, etc.
Grafana Visualization Integration (Optional)
-
Grafana Dashboard Configuration
Enable Grafana's embedding feature and enable anonymous access.
noteFor complete configuration details, please refer to the documentation: Grafana Historical Charts
-
Embed Grafana Dashboard in HertzBeat Monitor
After configuring and enabling Grafana, restart the HertzBeat service. Then, in the newly added AUTO monitor settings, enable Grafana Templates and upload a Grafana dashboard template.
For example: In Grafana, select
hertzbeat-victoria-metricsas the data source. Then click on the dashboard:「Share」→「Export」→「Save to file」to download the template and upload this file to the HertzBeat monitor.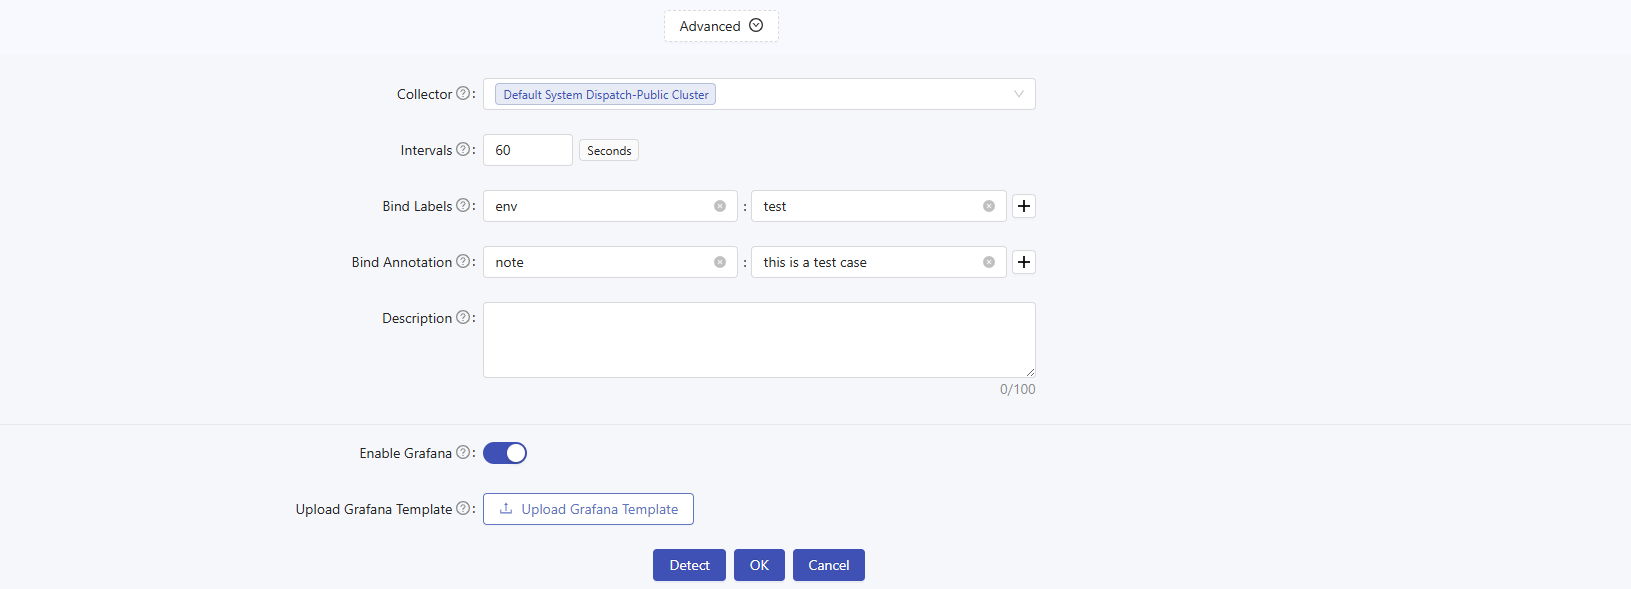
-
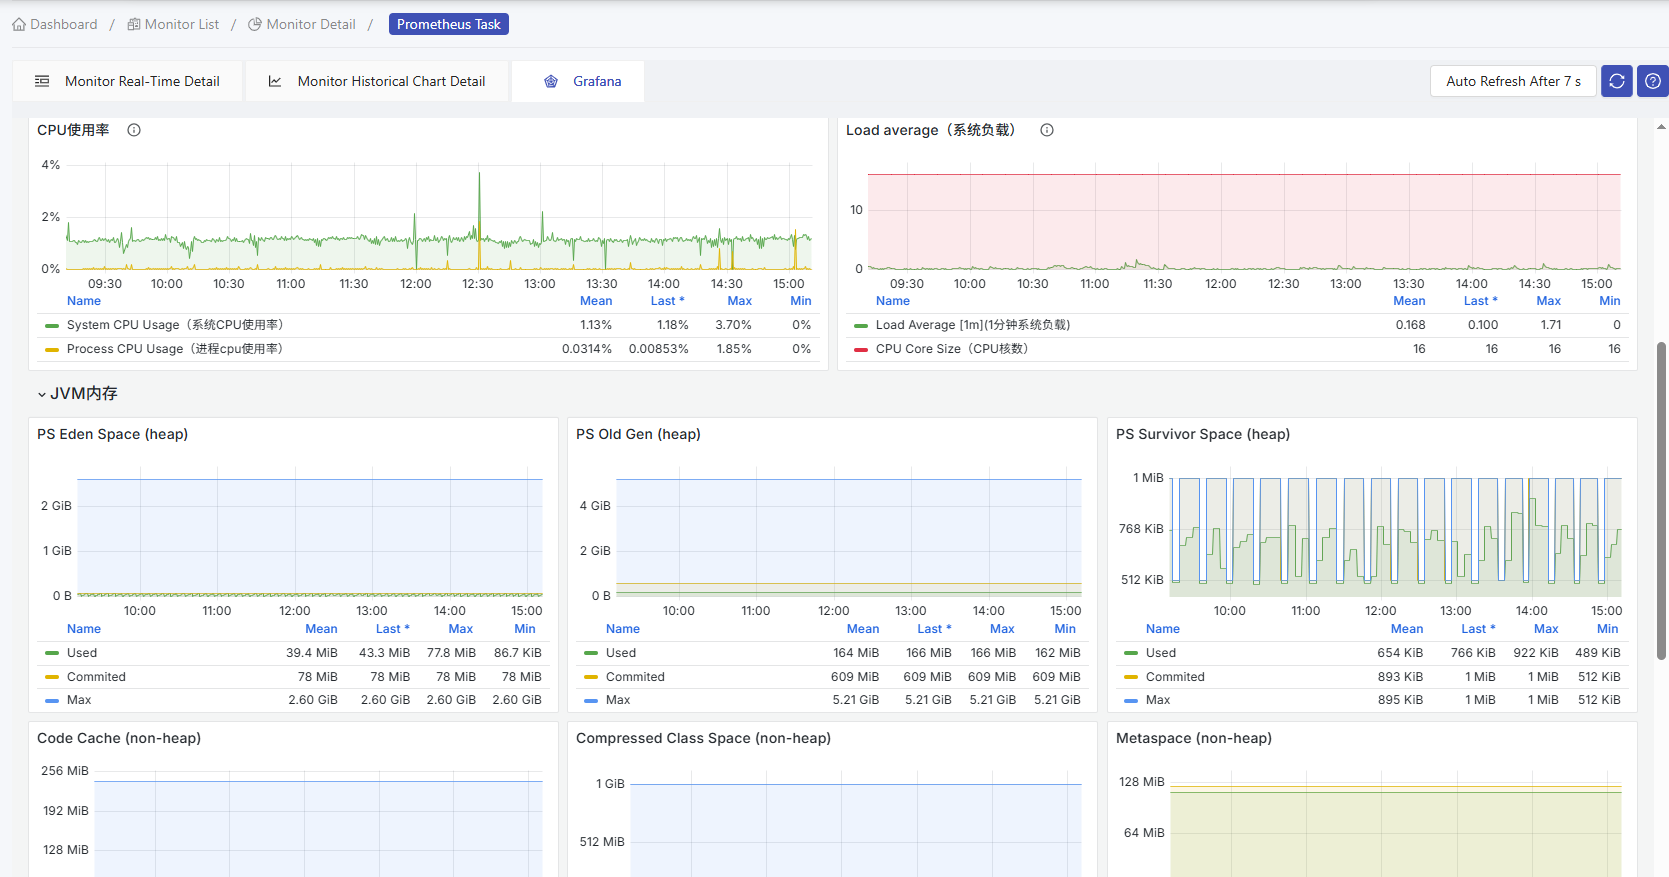
View Grafana Dashboard
Go to the AUTO monitor page, click the Grafana icon button, and view the integrated Grafana dashboard.
Alarm and Notification Interlinkage
-
HertzBeat Alarm Configuration
HertzBeat Page -> Alerting -> Threshold -> New -> New Threshold Rule
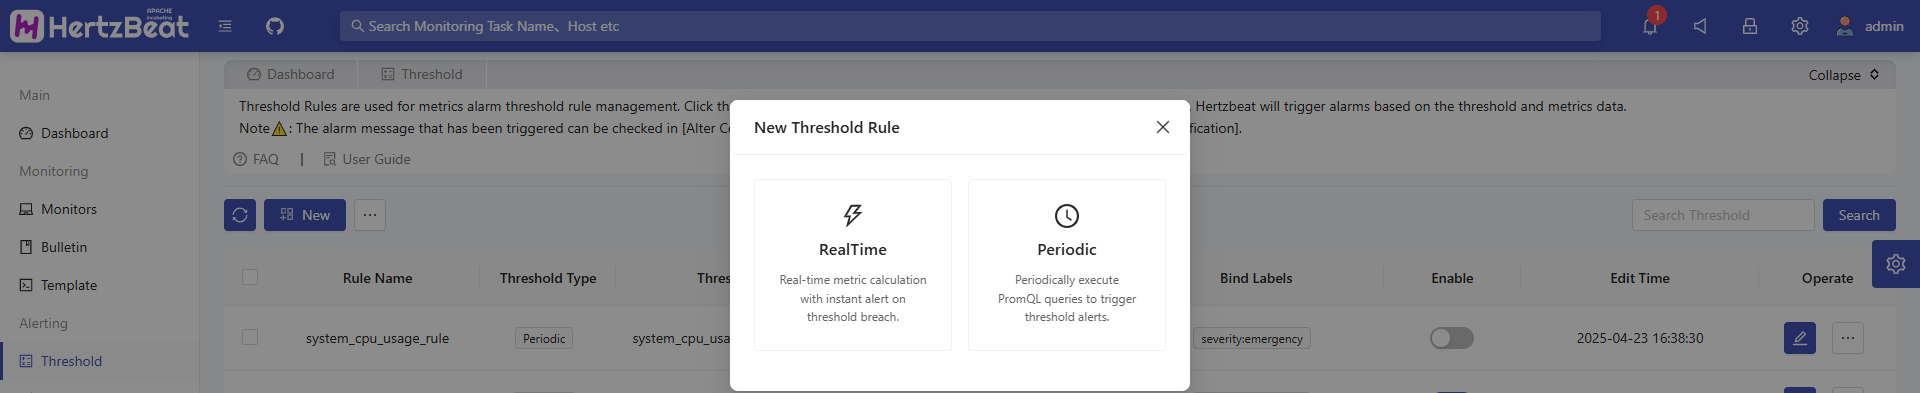
HertzBeat provides two types of threshold rule settings: RealTime Calculation and Periodically execute. Here, we use the Periodically execute threshold rule as an example.
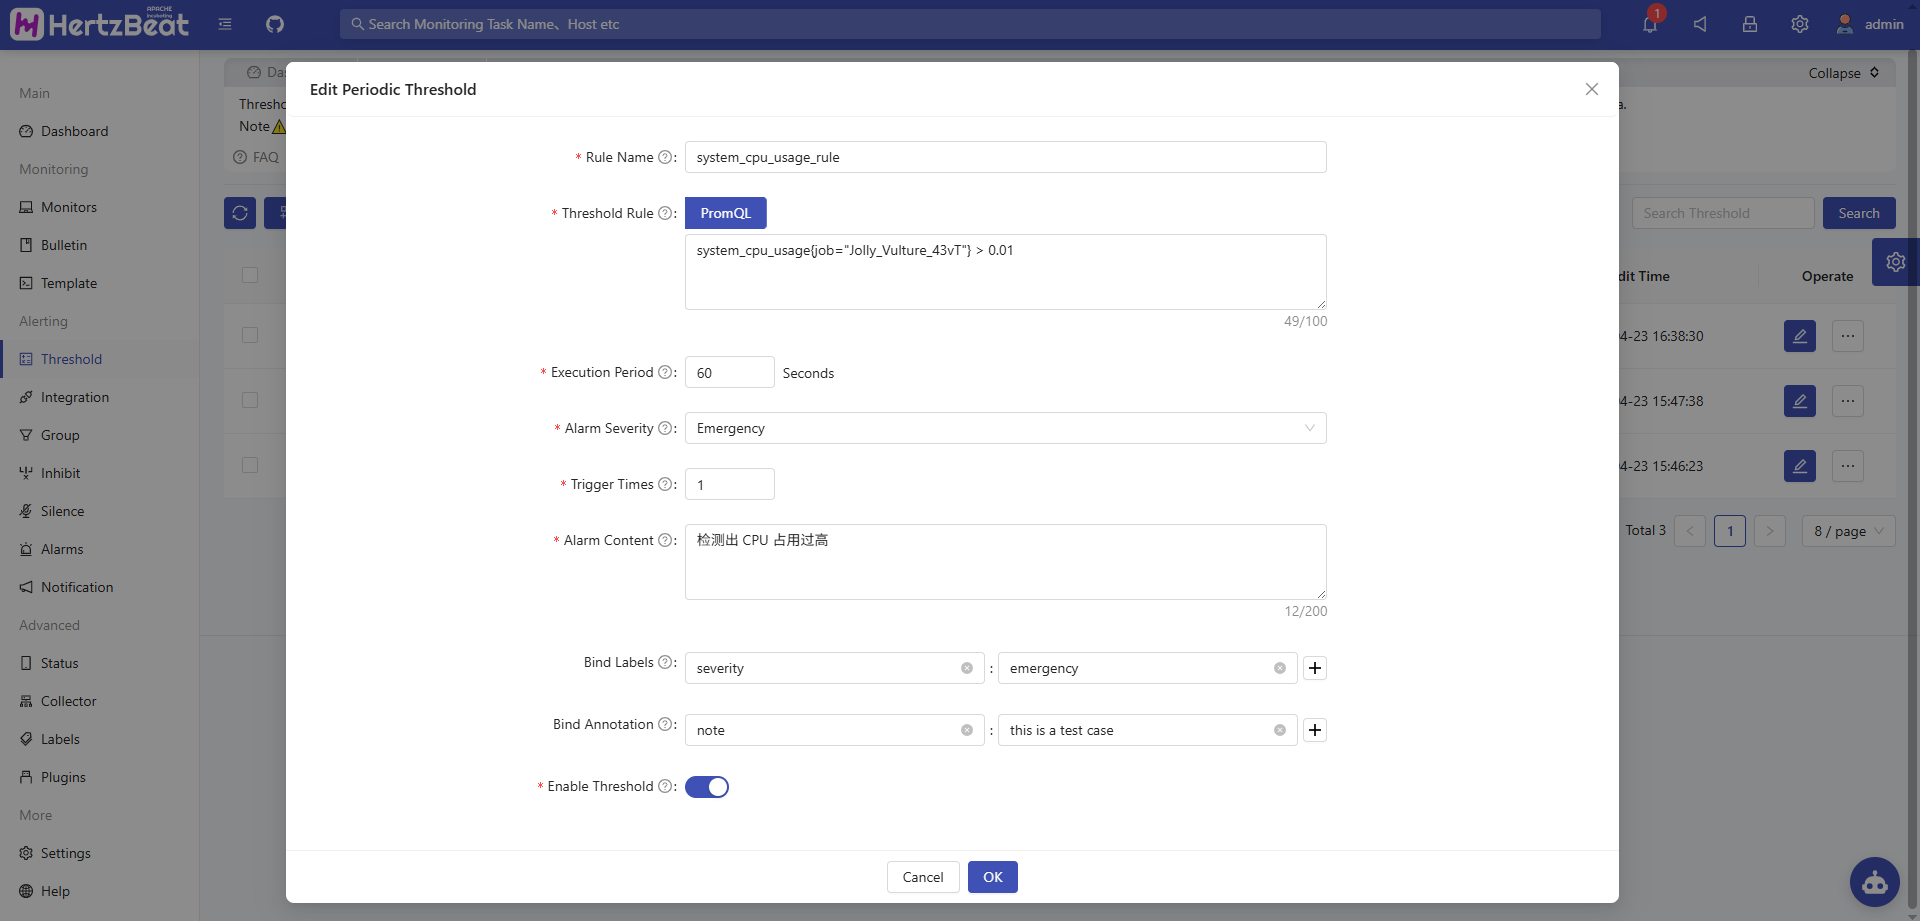
- Rule Name: Name of the threshold rule.
- Threshold Rule: Enter the rule for monitoring the metric (supports
PromQL). - Execution Period: The time interval for periodically executing the threshold calculation.
- Alarm Severity: The alarm level that triggers the threshold, from low to high: Warning,Critical,Emergency.
- Trigger Times: Set how many times the threshold is triggered before sending an alarm.
- Alarm Content: Enter the content of the monitoring alarm(supports variables).
-
Set Threshold Rule
For example, to monitor the CPU usage of the SpringBoot application, add a threshold rule like:
system_cpu_usage{job="Jolly_Vulture_43vT"}> 0.01`You can create many combinations of threshold rules. Users can set up richer alarm rules based on their specific needs.
Finally, you can see the triggered alarm in the alarm center.
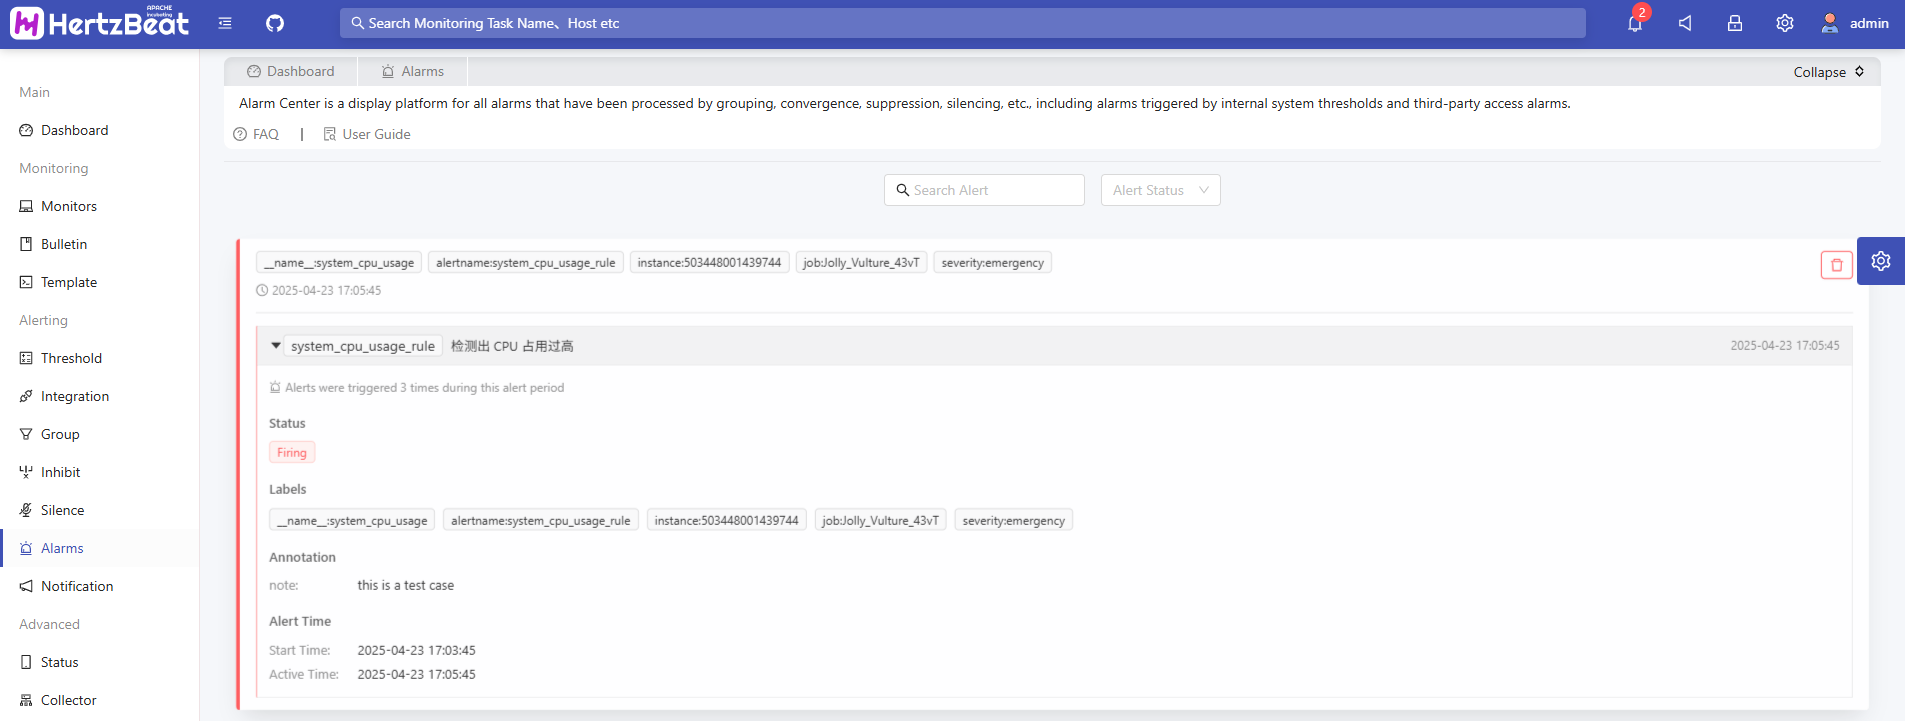
-
Alarm Notification
HertzBeat Page -> Notification -> Notice Receiver -> New Receiver
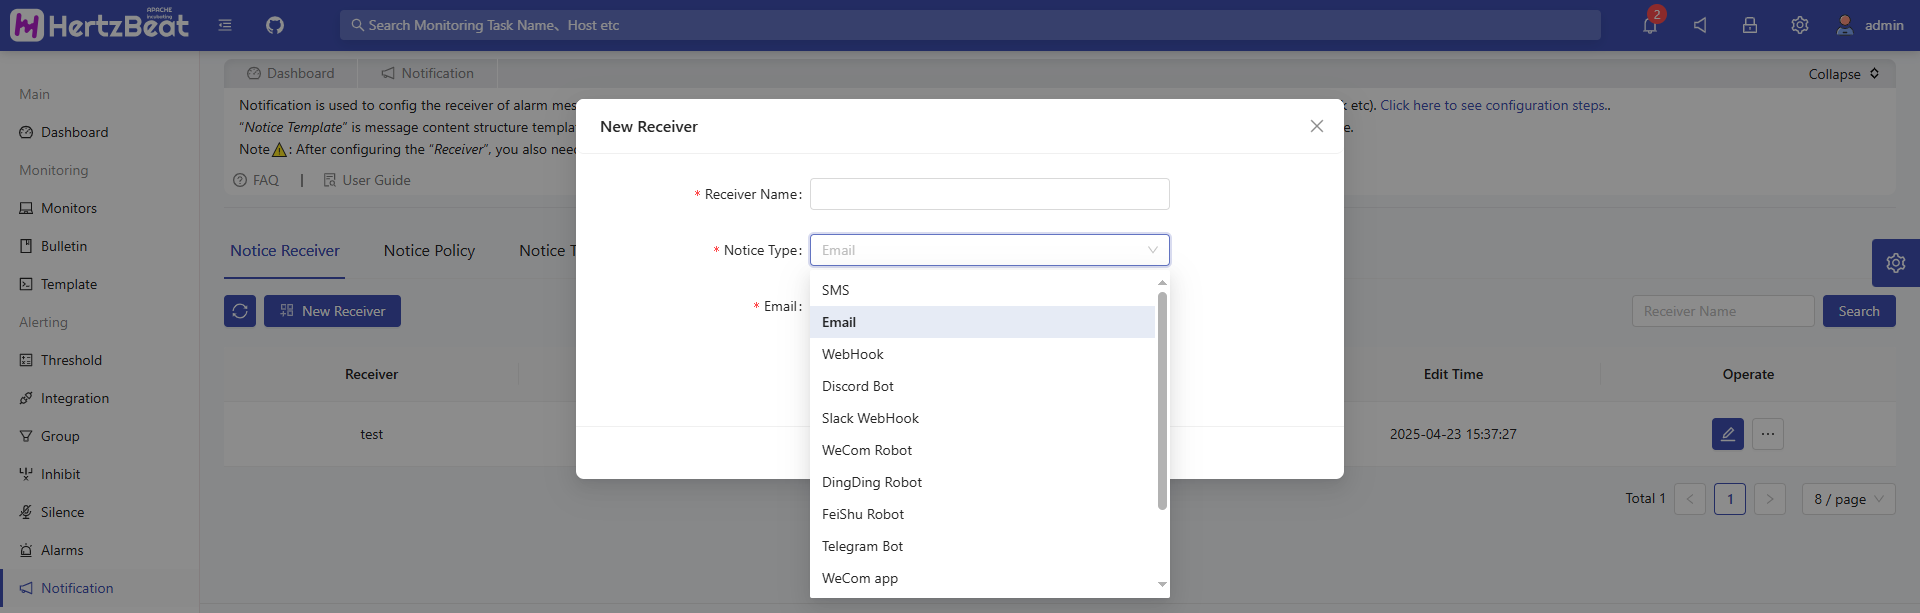
HertzBeat Page -> Notification -> Notice Policy -> New Notice Policy -> Select Recipient(s) and Enable Notification
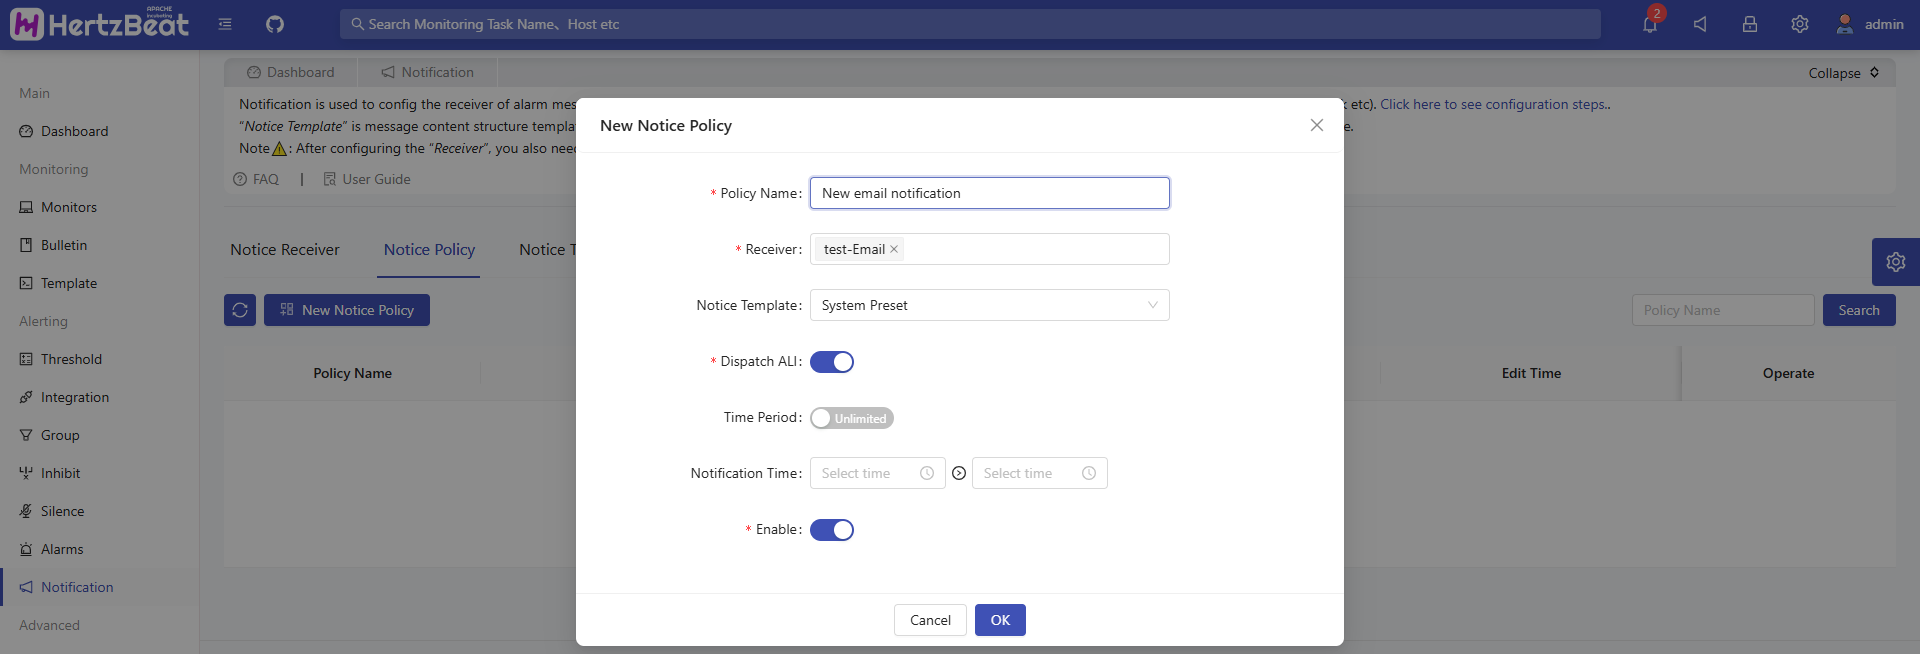
-
OK! When the threshold is triggered, we will receive the corresponding alarm message. If no notification is configured, you can also view the alarm information in the alarm center.
Quick Summary
This article demonstrates how users can build a complete monitoring system within minutes using simple configurations, highlighting several advantages of HertzBeat:
- Monitors SpringBoot Actuator endpoints without needing to deploy Exporter or Agent, supporting custom metric collection and alert rules.
- Lightweight: Compared to the traditional Prometheus + AlertManager combination, HertzBeat simplifies the deployment and maintenance process.
- Seamless Integration with Grafana: HertzBeat pushes collected time-series data to Grafana in real-time for building visualization dashboards.
- Integrated Monitoring + Alerting + Notification: Combines full protocol coverage, real-time/periodic threshold detection, and multi-channel notifications (DingTalk/Feishu/Webhook, etc.).
Wrapping Up
That concludes this practical guide on monitoring SpringBoot applications with HertzBeat. Of course, this functionality is just the tip of the iceberg for HertzBeat. If you think hertzbeat is a good open source project, please give it a Star on GitHub and Gitee! Your Star motivate our continuous improvement! Feel free to light up the little star ✨
Making monitoring simpler, looking forward to building the ecosystem together! 💝