Tutorial 2 Obtain TOKEN index value based on HTTP protocol for subsequent collection and authentication
Through this tutorial, we will describe step by step how to modify on the basis of tutorial 1, add metrics, first call the authentication interface to obtain the TOKEN, and use the TOKEN as a parameter for the subsequent metrics collection and authentication.
Before reading this tutorial, we hope that you are familiar with how to customize types, metrics, protocols, etc. from Custom Monitoring and http Protocol Customization.
Request process
【Authentication information metrics (highest priority)】【HTTP interface carries account password call】->【Response data analysis】->【Analysis and issuance of TOKEN-accessToken as an metric] -> [Assign accessToken as a variable parameter to other collection index groups]
Here we still use the hertzbeat monitoring example of Tutorial 1! The hertzbeat background interface not only supports the basic direct account password authentication used in Tutorial 1, but also supports token authentication.
We need POST to call the login interface /api/account/auth/form to get accessToken, the request body (json format) is as follows:
{
   "credential": "hertzbeat",
   "identifier": "admin"
}
The response structure data is as follows:
{
   "data": {
     "token": "xxxx",
     "refreshToken": "xxxx"
   },
   "msg": null,
   "code": 0
}
Add custom monitoring type hertzbeat_token
HertzBeat Dashboard -> Monitoring Templates -> New Template -> Config Monitoring Template Yml -> Save and Apply -> Add A Monitoring with The New Monitoring Type
We define all monitoring collection types (mysql,jvm,k8s) as yml monitoring templates, and users can import these templates to support corresponding types of monitoring.
Monitoring template is used to define the name of monitoring type(international), request parameter mapping, index information, collection protocol configuration information, etc.
- The custom monitoring type needs to add a new configuration monitoring template yml. We directly reuse the
hertzbeatmonitoring type in Tutorial 1 and modify it based on it
A monitoring configuration definition file named after the monitoring type - hertzbeat_token
We directly reuse the definition content in hertzbeat and modify it to our current monitoring type hertzbeat_auth configuration parameters, such as app, category, etc.
# This monitoring type belongs to the category: service-application service monitoring db-database monitoring custom-custom monitoring os-operating system monitoring
category: custom
# Monitoring application type (consistent with the file name) eg: linux windows tomcat mysql aws...
app: hertzbeat_token
name:
   en-GB: HertzBeat Monitoring (Token)
   en-US: Hertz Beat Monitor (Token)
params:
   # field - field name identifier
   - field: host
     # name - parameter field display name
     name:
       en-CN: Host Host
       en-US: Host
     # type-field type, style (mostly map input tag type attribute)
     type: host
     # Whether it is a required item true-required false-optional
     required: true
   - field: port
     name:
       en-CN: port
       en-US: Port
     type: number
     # When the type is number, use range to represent the range
     range: '[0,65535]'
     required: true
     # port default
     defaultValue: 1157
     # Parameter input box prompt information
     placeholder: 'Please enter the port'
   - field: ssl
     name:
       en-CN: Enable SSL
       en-US: SSL
     # When the type is boolean, the front end uses switch to display the switch
     type: boolean
     required: false
   - field: contentType
     name:
       en-CN: Content-Type
       en-US: Content-Type
     type: text
     placeholder: 'Request Body Type'
     required: false
   - field: payload
     name:
       en-CN: request BODY
       en-US: BODY
     type: textarea
     placeholder: 'Available When POST PUT'
     required: false
# Index group list configuration under todo
metrics: ....
Define metrics auth login request to get token
- Add an index group definition
authinhertzbeat_token, set the collection priority to the highest 0, and collect the indextoken.
# This monitoring type belongs to the category: service-application service monitoring db-database monitoring custom-custom monitoring os-operating system monitoring
category: custom
# Monitoring application type (consistent with the file name) eg: linux windows tomcat mysql aws...
app: hertzbeat_token
name:
   en-GB: HertzBeat Monitoring (Token)
   en-US: Hertz Beat Monitor (Token)
params:
   # field - field name identifier
   - field: host
     # name - parameter field display name
     name:
       en-CN: Host Host
       en-US: Host
     # type-field type, style (mostly map input tag type attribute)
     type: host
     # Whether it is a required item true-required false-optional
     required: true
   - field: port
     name:
       en-CN: port
       en-US: Port
     type: number
     # When the type is number, use range to represent the range
     range: '[0,65535]'
     required: true
     # port default
     defaultValue: 1157
     # Parameter input box prompt information
     placeholder: 'Please enter the port'
   - field: ssl
     name:
       en-CN: Enable SSL
       en-US: SSL
     # When the type is boolean, the front end uses switch to display the switch
     type: boolean
     required: false
   - field: contentType
     name:
       en-CN: Content-Type
       en-US: Content-Type
     type: text
     placeholder: 'Request Body Type'
     required: false
   - field: payload
     name:
       en-CN: request BODY
       en-US: BODY
     type: textarea
     placeholder: 'Available When POST PUT'
     required: false
# List of metricss
metrics:
   # The first monitoring index group auth
   # Note: Built-in monitoring metrics have (responseTime - response time)
   - name: auth
     # The smaller the index group scheduling priority (0-127), the higher the priority, and the index group with low priority will not be scheduled until the collection of index groups with high priority is completed, and the index groups with the same priority will be scheduled and collected in parallel
     # The metrics with priority 0 is the availability metrics, that is, it will be scheduled first, and other metricss will continue to be scheduled if the collection is successful, and the scheduling will be interrupted if the collection fails
     priority: 0
     # Specific monitoring metrics in the metrics
     fields:
       # metric information includes field name type field type: 0-number, 1-string , label-if is metrics label,  unit: metric unit
       - field: token
         type: 1
       - field: refreshToken
         type: 1
     # Monitoring and collection protocol eg: sql, ssh, http, telnet, wmi, snmp, sdk
     protocol: http
     # When the protocol is the http protocol, the specific collection configuration
     http:
       host: ^_^host^_^
       # port
       port: ^_^port^_^
       # url request interface path
       url: /api/account/auth/form
       # Request method GET POST PUT DELETE PATCH
       method: POST
       # Whether to enable ssl/tls, that is, http or https, default false
       ssl: ^_^ssl^_^
       payload: ^_^payload^_^
       # request header content
       headers:
         content-type: ^_^contentType^_^
       # Response data analysis method: default-system rules, jsonPath-jsonPath script, website-website usability metric monitoring
       parseType: jsonPath
       parseScript: '$.data'
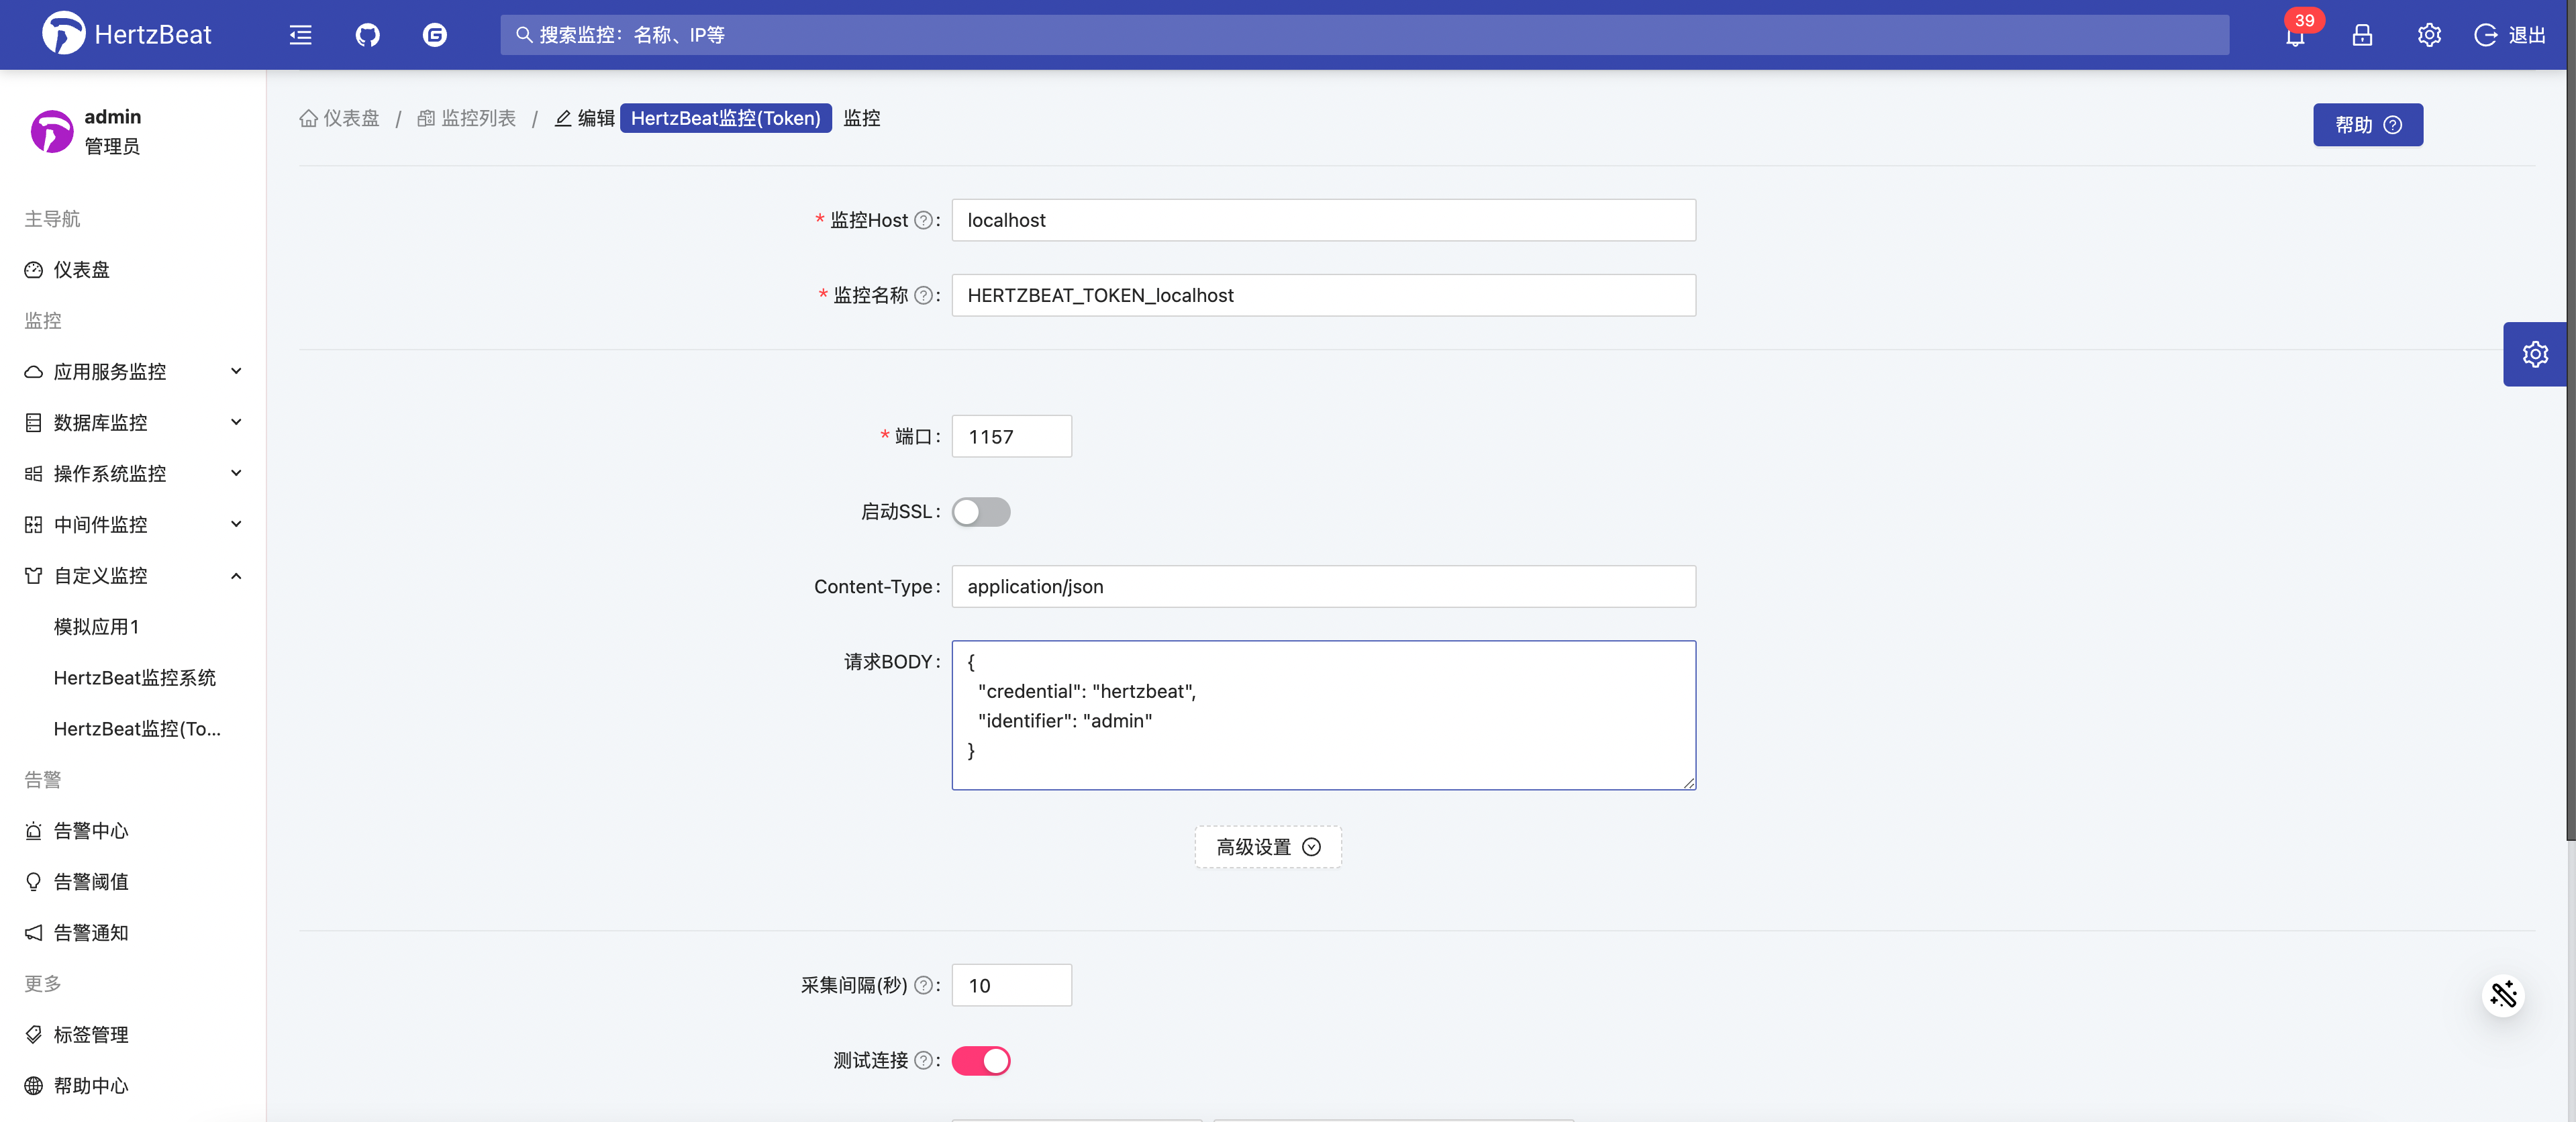
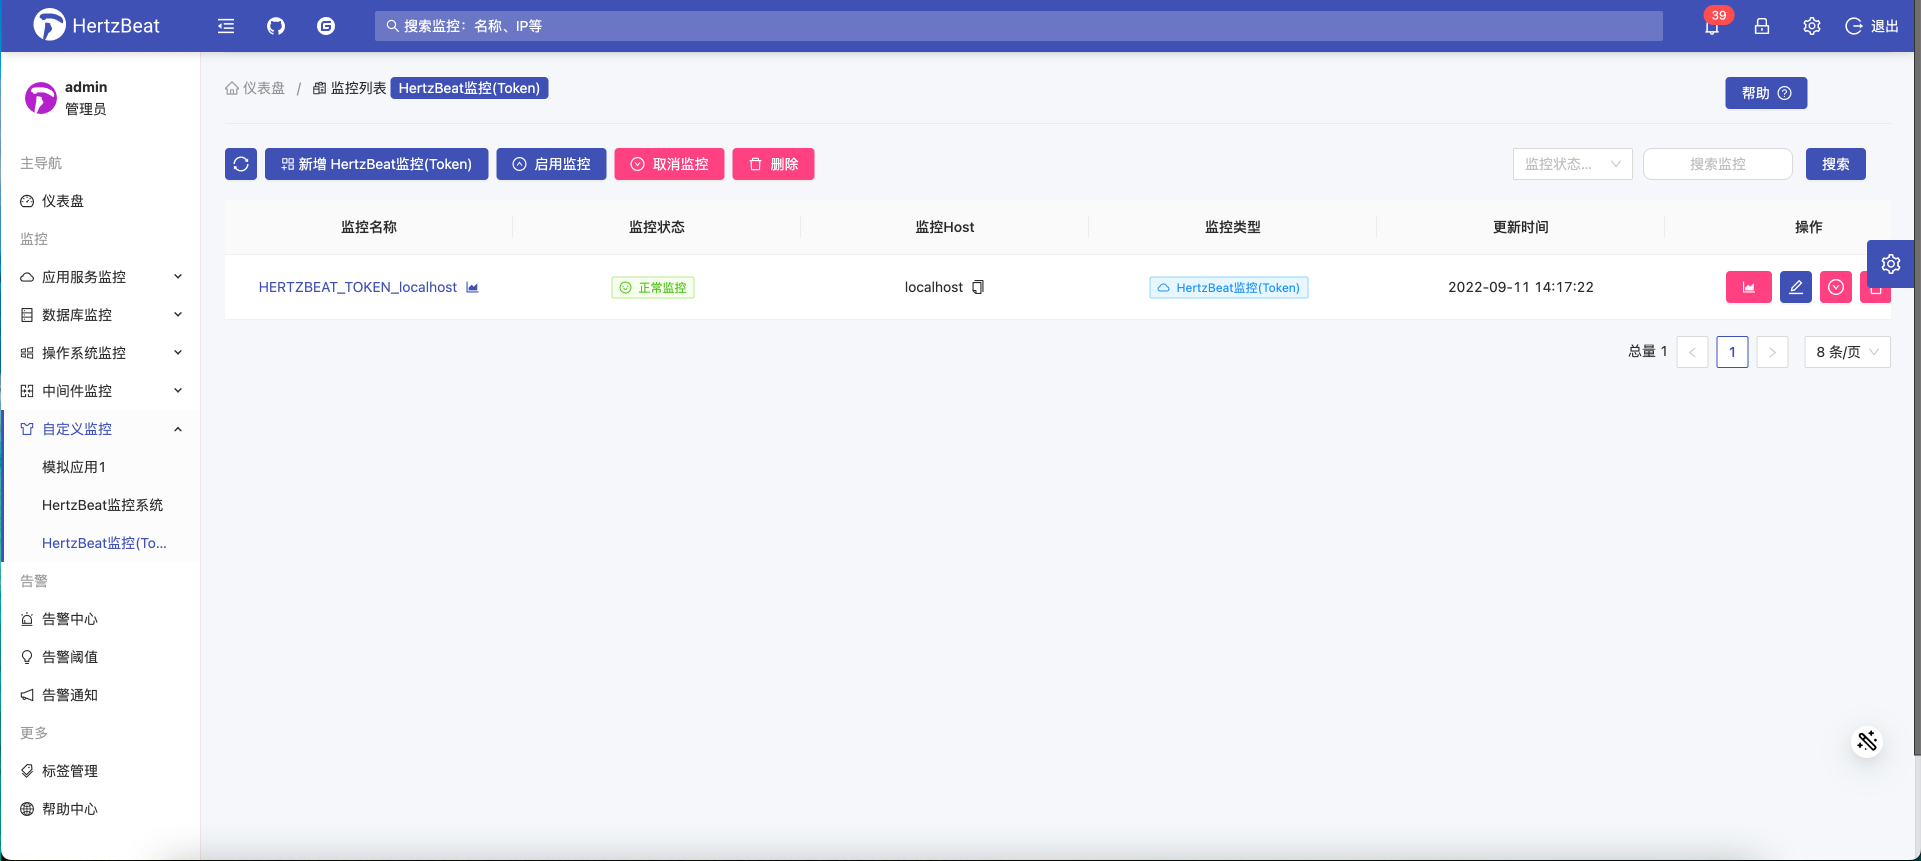
At this time, save and apply, add hertzbeat_token type monitoring on the system page, configure input parameters, content-type fill in application/json, request Body fill in the account password json as follows:
{
   "credential": "hertzbeat",
   "identifier": "admin"
}

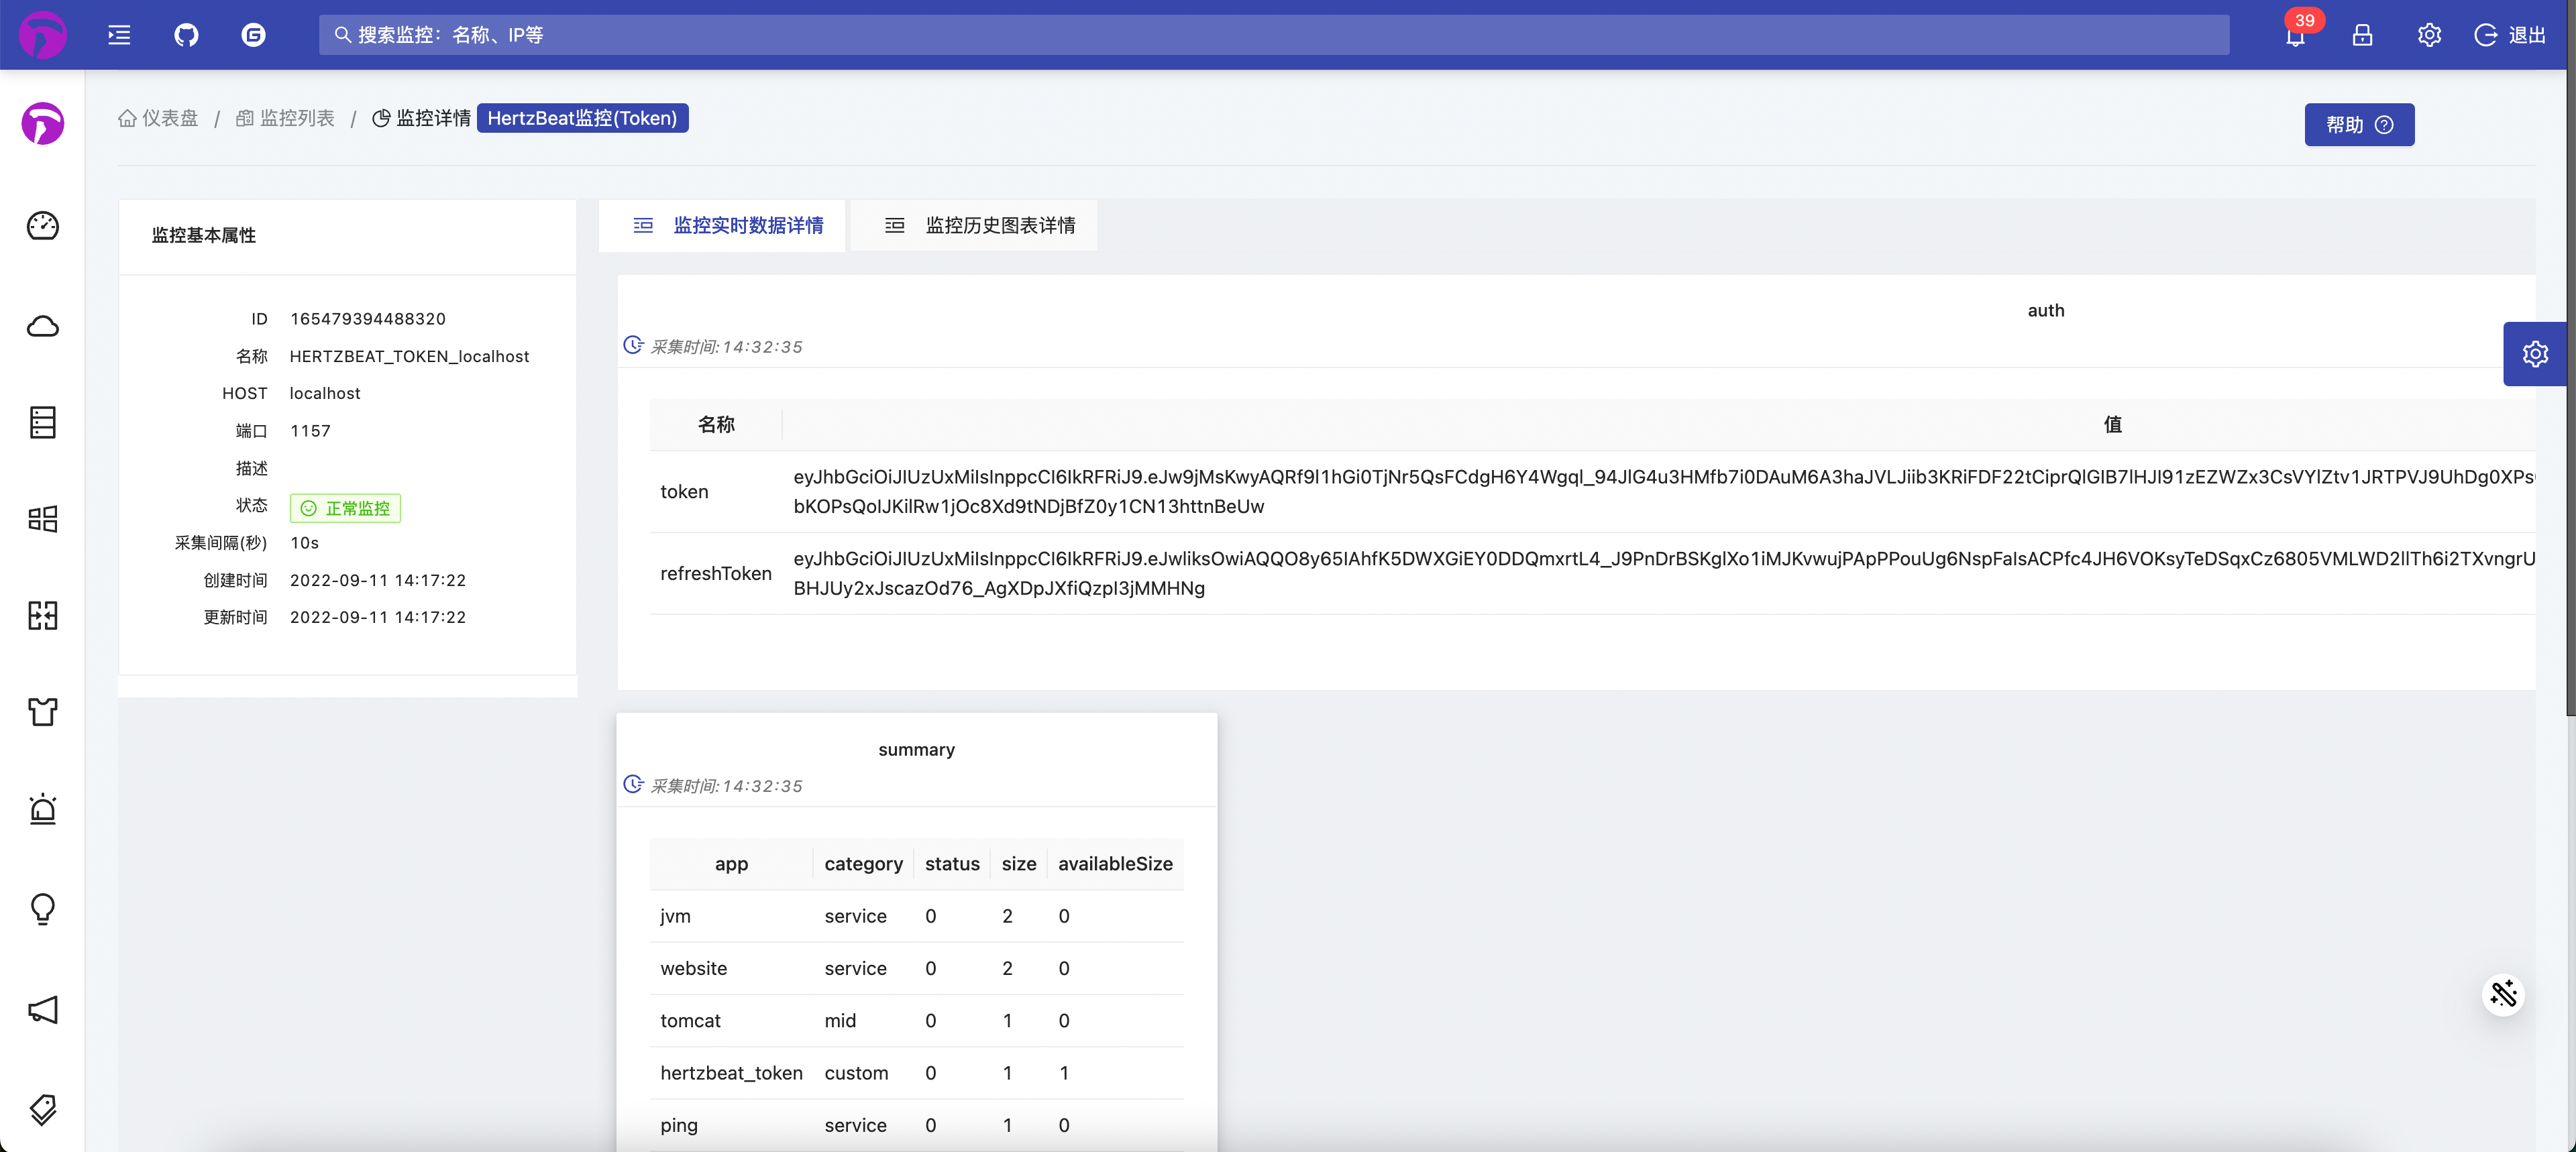
After the addition is successful, we can see the token, refreshToken metric data we collected on the details page.


Use token as a variable parameter to collect and use the following metricss
Add an index group definition summary in app-hertzbeat_token.yml, which is the same as summary in Tutorial 1, and set the collection priority to 1
Set the authentication method in the HTTP protocol configuration of this index group to Bearer Token, assign the index token collected by the previous index group auth as a parameter, and use ^o^ as the internal replacement symbol, that is ^o^token^o^. as follows:
   - name: summary
# When the protocol is the http protocol, the specific collection configuration
     http:
       # authentication
       authorization:
         # Authentication methods: Basic Auth, Digest Auth, Bearer Token
         type: Bearer Token
         bearerTokenToken: ^o^token^o^
The final hertzbeat_token template yml is defined as follows:
# This monitoring type belongs to the category: service-application service monitoring db-database monitoring custom-custom monitoring os-operating system monitoring
category: custom
# Monitoring application type (consistent with the file name) eg: linux windows tomcat mysql aws...
app: hertzbeat_token
name:
   en-GB: HertzBeat Monitoring (Token)
   en-US: Hertz Beat Monitor (Token)
params:
   # field - field name identifier
   - field: host
     # name - parameter field display name
     name:
       en-CN: Host Host
       en-US: Host
     # type-field type, style (mostly map input tag type attribute)
     type: host
     # Whether it is a required item true-required false-optional
     required: true
   - field: port
     name:
       en-CN: port
       en-US: Port
     type: number
     # When the type is number, use range to represent the range
     range: '[0,65535]'
     required: true
     # port default
     defaultValue: 1157
     # Parameter input box prompt information
     placeholder: 'Please enter the port'
   - field: ssl
     name:
       en-CN: Enable SSL
       en-US: SSL
     # When the type is boolean, the front end uses switch to display the switch
     type: boolean
     required: false
   - field: contentType
     name:
       en-CN: Content-Type
       en-US: Content-Type
     type: text
     placeholder: 'Request Body Type'
     required: false
   - field: payload
     name:
       en-CN: request BODY
       en-US: BODY
     type: textarea
     placeholder: 'Available When POST PUT'
     required: false
# List of metricss
metrics:
# The first monitoring index group cpu
# Note: Built-in monitoring metrics have (responseTime - response time)
   - name: auth
     # The smaller the index group scheduling priority (0-127), the higher the priority, and the index group with low priority will not be scheduled until the collection of index groups with high priority is completed, and the index groups with the same priority will be scheduled and collected in parallel
     # The metrics with priority 0 is the availability metrics, that is, it will be scheduled first, and other metricss will continue to be scheduled if the collection is successful, and the scheduling will be interrupted if the collection fails
     priority: 0
     # Specific monitoring metrics in the metrics
     fields:
       # metric information includes field name type field type: 0-number, 1-string , label-if is metrics label,  unit: metric unit
       - field: token
         type: 1
       - field: refreshToken
         type: 1
     # Monitoring and collection protocol eg: sql, ssh, http, telnet, wmi, snmp, sdk
     protocol: http
     # When the protocol is the http protocol, the specific collection configuration
     http:
       host: ^_^host^_^
       # port
       port: ^_^port^_^
       # url request interface path
       url: /api/account/auth/form
       # Request method GET POST PUT DELETE PATCH
       method: POST
       # Whether to enable ssl/tls, that is, http or https, default false
       ssl: ^_^ssl^_^
       payload: ^_^payload^_^
       # request header content
       headers:
         content-type: ^_^contentType^_^
         ^_^headers^_^: ^_^headers^_^
       # Request parameter content
       params:
         ^_^params^_^: ^_^params^_^
       # Response data analysis method: default-system rules, jsonPath-jsonPath script, website-website usability metric monitoring
       parseType: jsonPath
       parseScript: '$.data'
---
   - name: summary
     # The smaller the index group scheduling priority (0-127), the higher the priority, and the index group with low priority will not be scheduled until the collection of index groups with high priority is completed, and the index groups with the same priority will be scheduled and collected in parallel
     # The metrics with priority 0 is the availability metrics, that is, it will be scheduled first, and other metricss will continue to be scheduled if the collection is successful, and the scheduling will be interrupted if the collection fails
     priority: 1
     # Specific monitoring metrics in the metrics
     fields:
       # metric information includes field name type field type: 0-number, 1-string , label-if is metrics label,  unit: metric unit
       - field: category
         type: 1
       - field: app
         type: 1
       - field: size
         type: 0
       - field: status
         type: 0
# Monitoring and collection protocol eg: sql, ssh, http, telnet, wmi, snmp, sdk
     protocol: http
# When the protocol is the http protocol, the specific collection configuration
     http:
       host: ^_^host^_^
       # port
       port: ^_^port^_^
       # url request interface path
       url: /api/summary
       # Request method GET POST PUT DELETE PATCH
       method: GET
       # Whether to enable ssl/tls, that is, http or https, default false
       ssl: ^_^ssl^_^
       # authentication
       authorization:
         # Authentication methods: Basic Auth, Digest Auth, Bearer Token
         type: Bearer Token
         bearerTokenToken: ^o^token^o^
       # Response data analysis method: default-system rules, jsonPath-jsonPath script, website-website usability metric monitoring
       parseType: jsonPath
       parseScript: '$.data.apps.*'
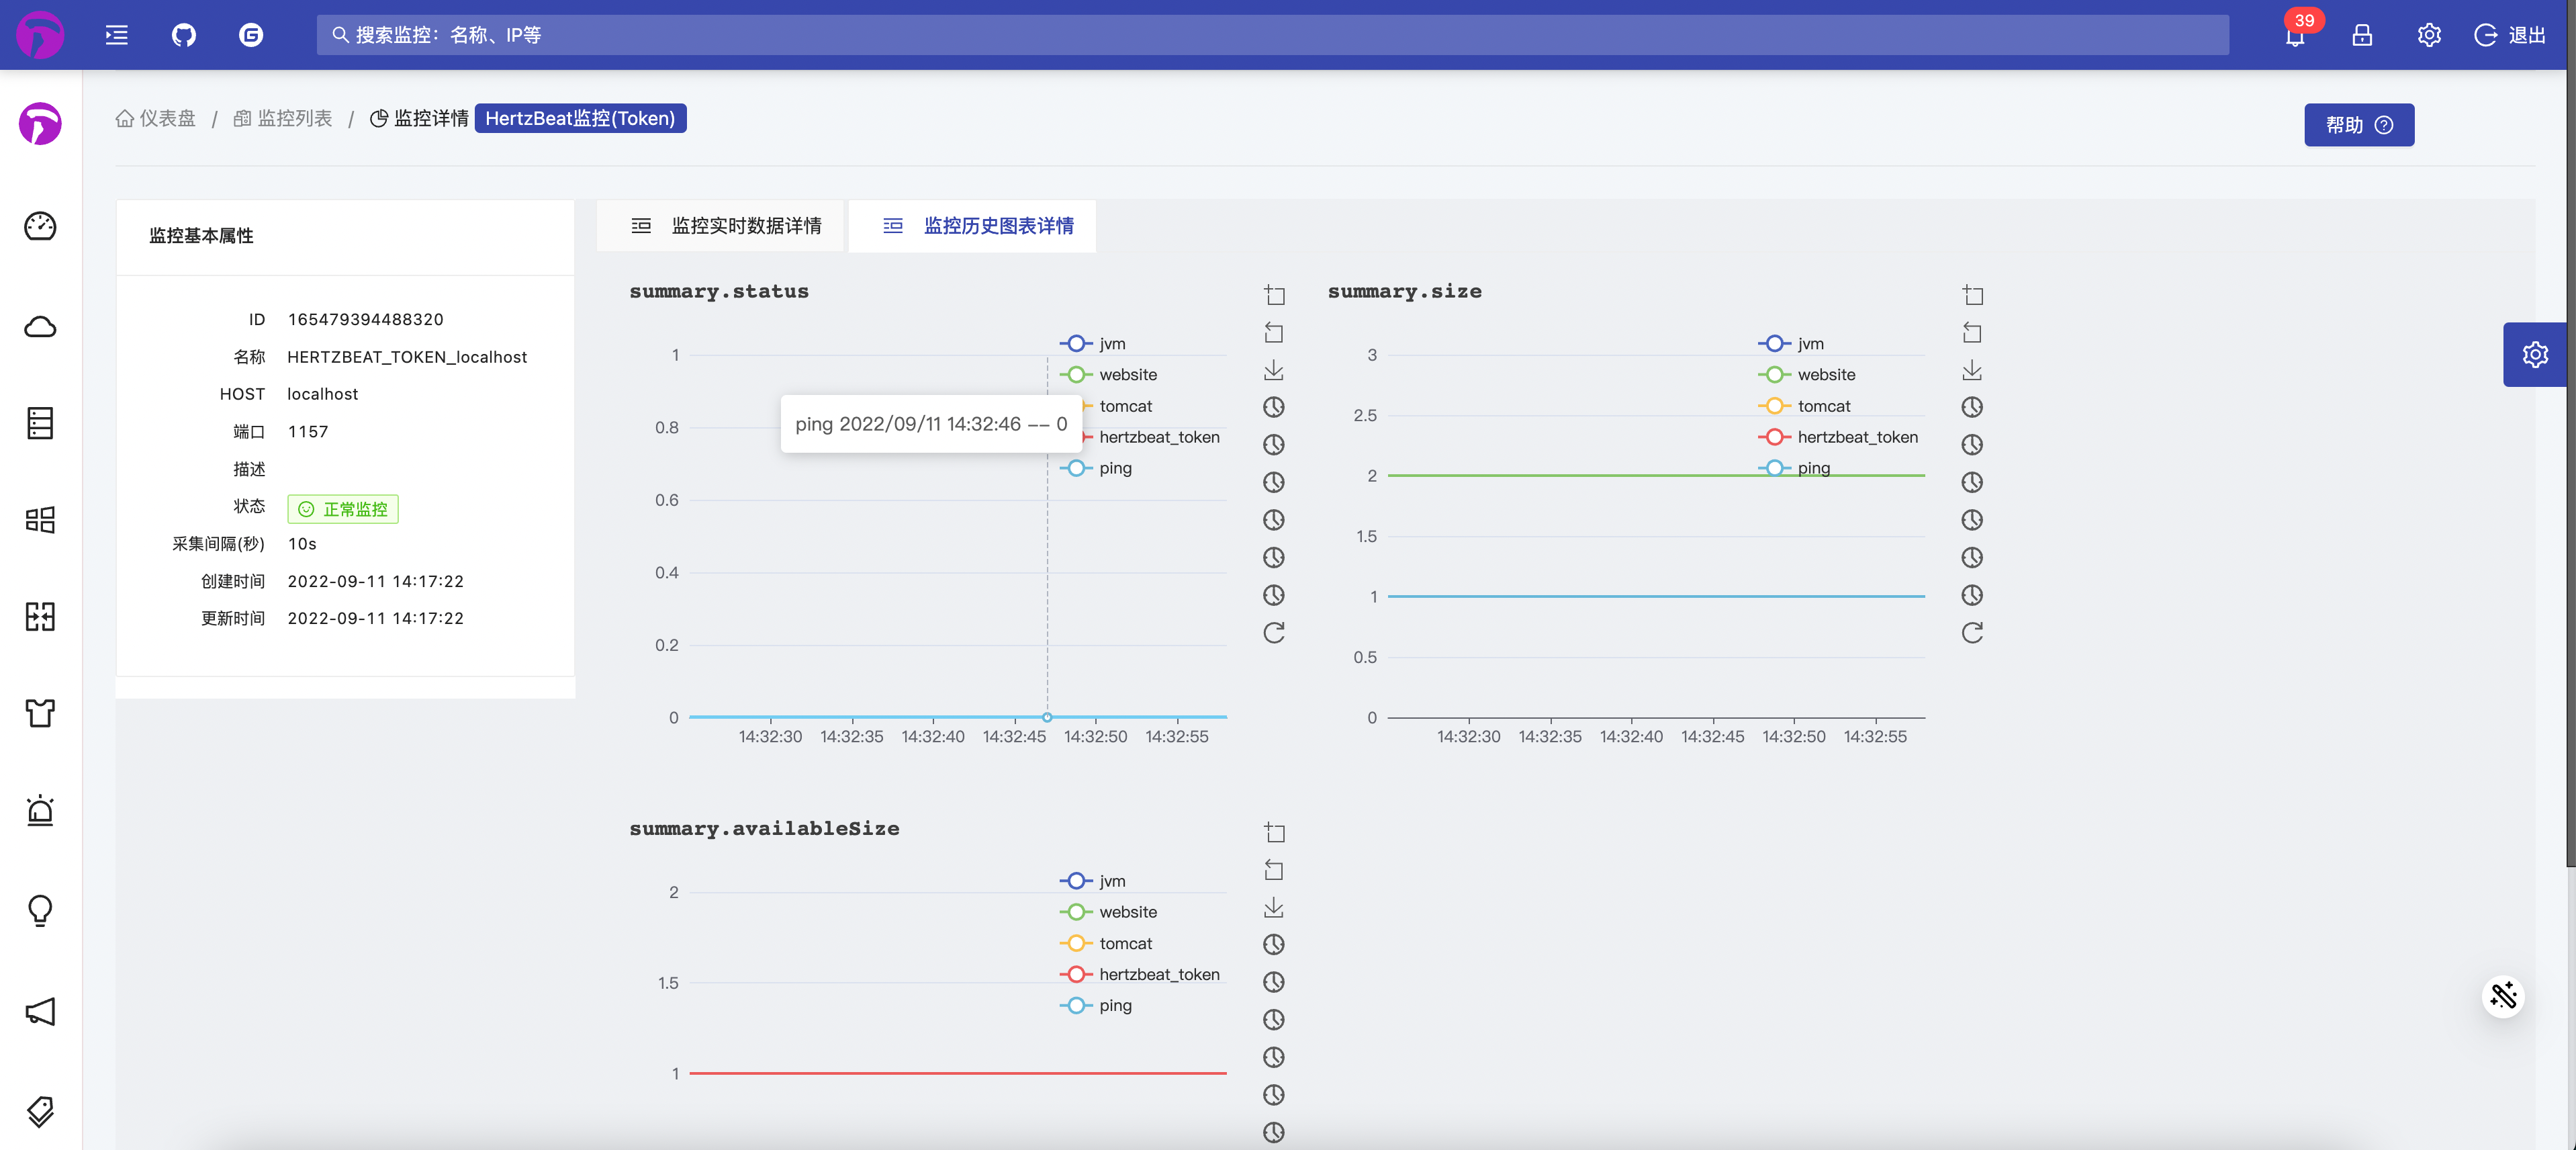
After the configuration is complete, save and apply, and check the monitoring details page


Set threshold alarm notification
Next, we can set the threshold normally. After the alarm is triggered, we can view it in the alarm center, add a new recipient, set alarm notification, etc. Have Fun!!!
over
This is the end of the practice of custom monitoring of the HTTP protocol. The HTTP protocol also has other parameters such as headers and params. We can define it like postman, and the playability is also very high!
If you think hertzbeat is a good open source project, please star us on GitHub Gitee, thank you very much.