Log Management (Beta)
HertzBeat's log management feature provides comprehensive log data management capabilities, including log querying, statistical analysis, and batch deletion operations. Users can precisely search logs through various filter conditions, view detailed statistical charts, and clean up unnecessary log data.
The log management feature is currently in Beta (experimental) stage. There may be potential defects and limitations. The feature is under active development and iteration.
Prerequisites
Before using the log management feature, you must first configure a database that supports log storage.
Feature Overview
In the HertzBeat interface, navigate to "Logs" -> "Log Management" page, where you'll see a comprehensive log management interface.
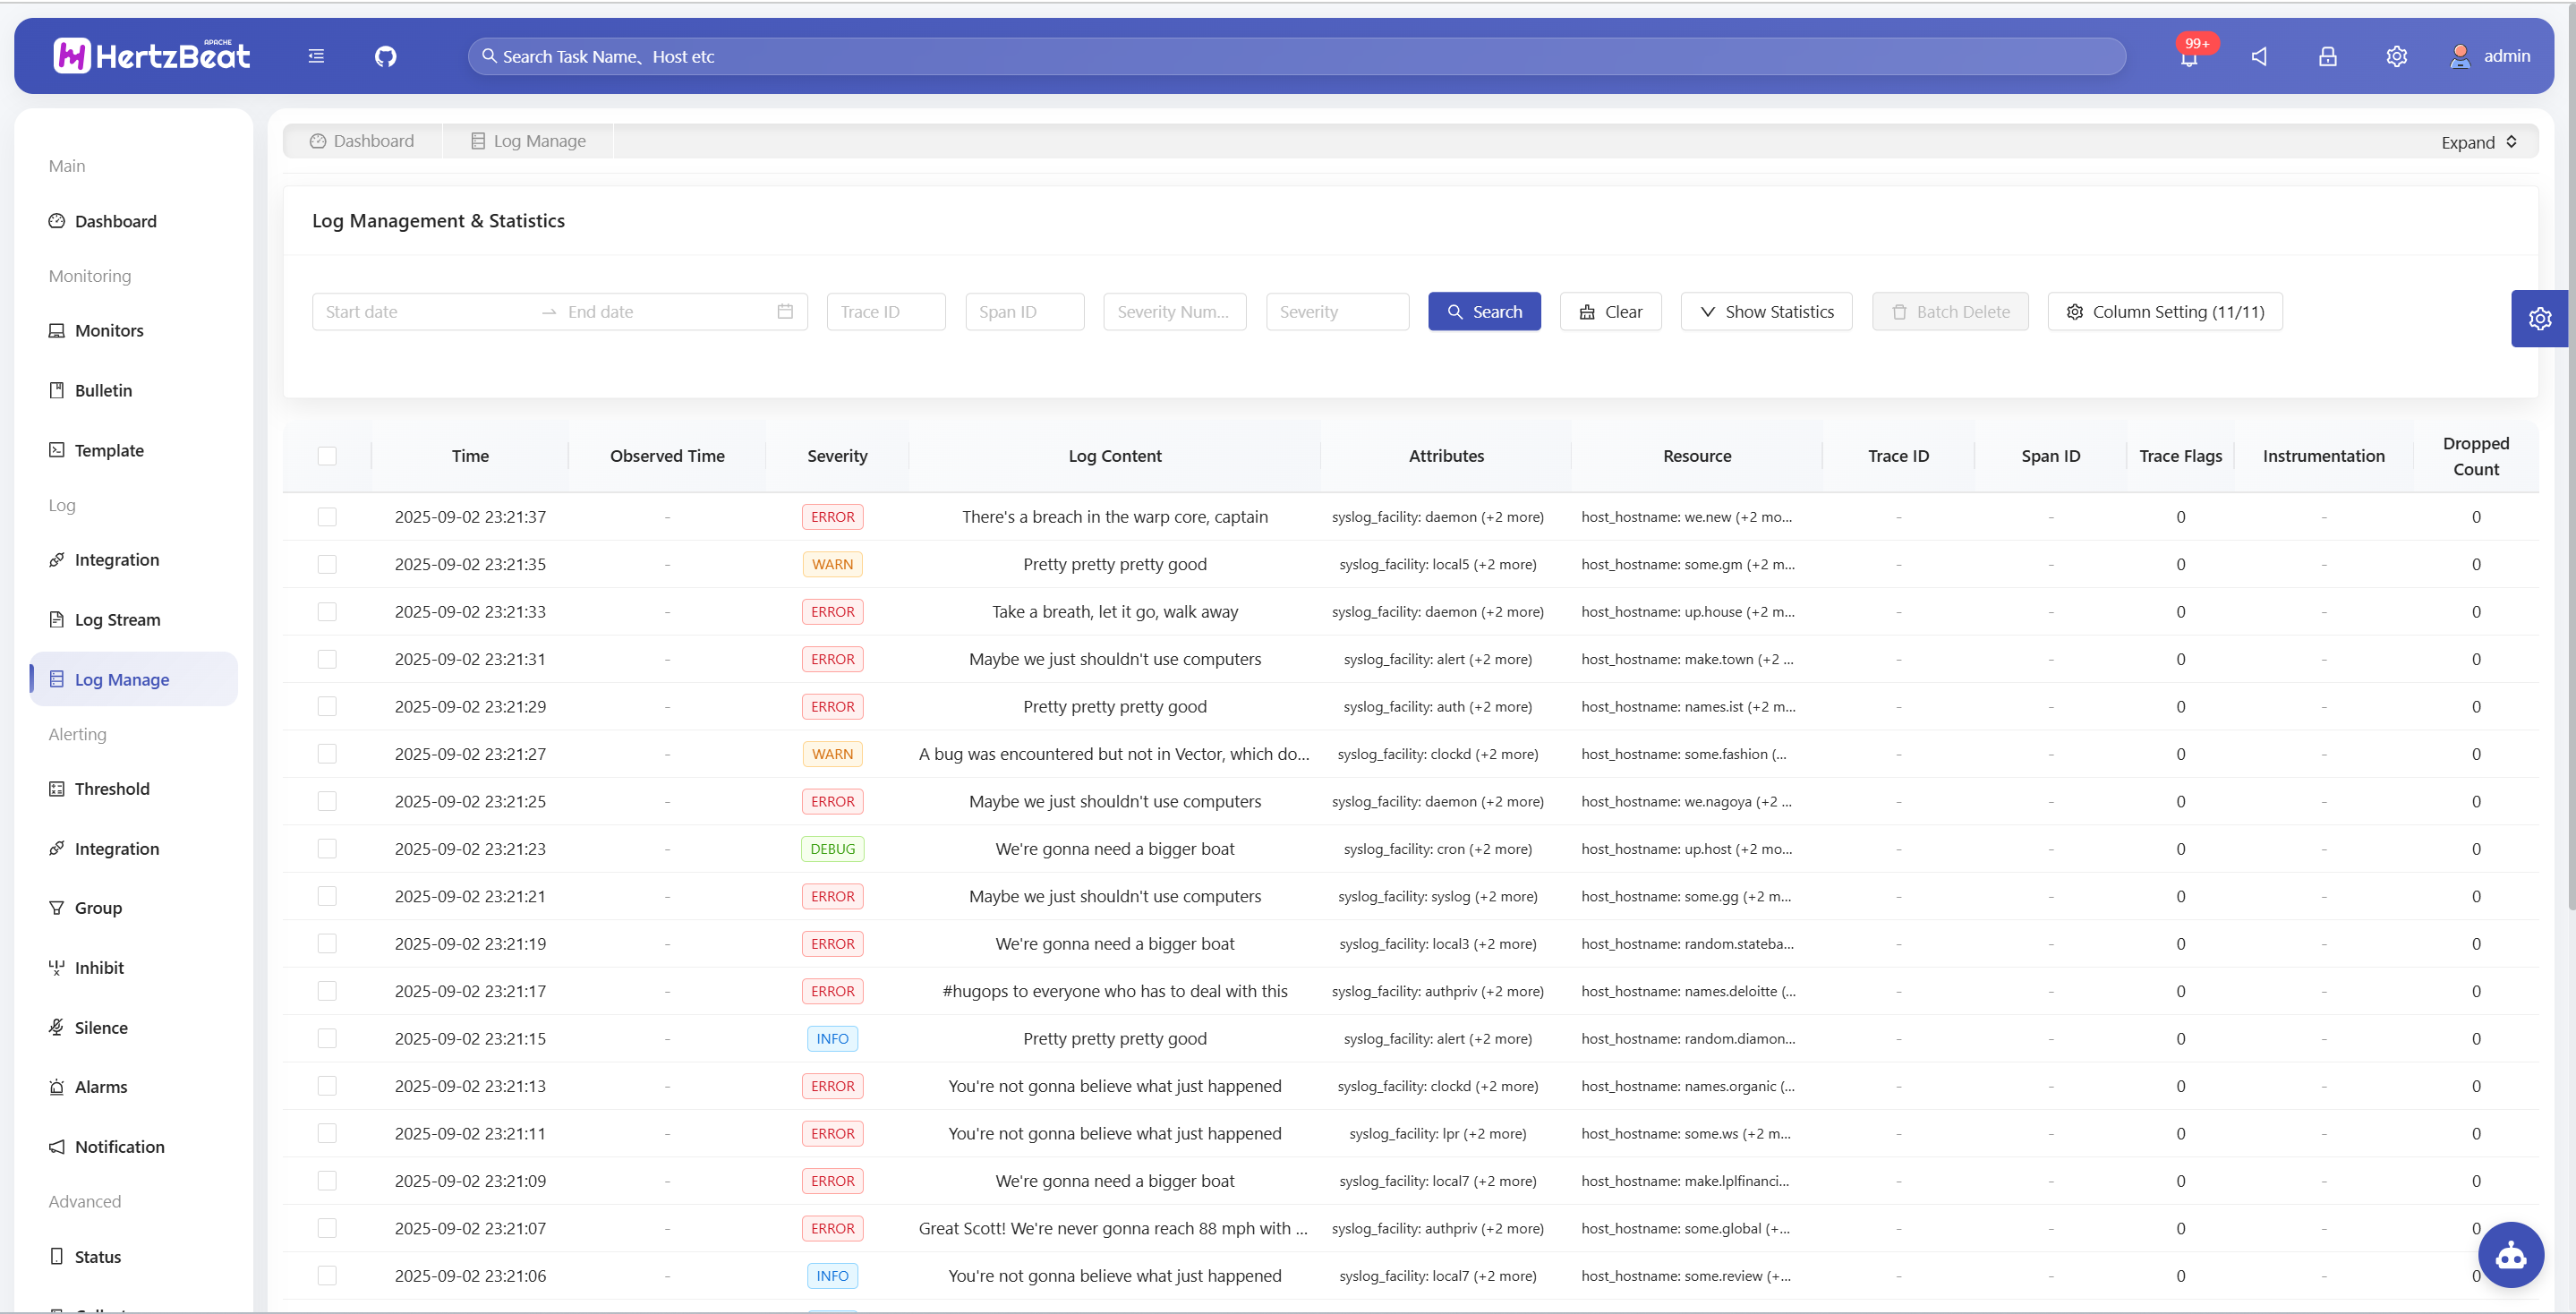
Log Query Features
Filter Conditions
Log management supports the following filter conditions for precise querying:
| Filter Condition | Field Name | Data Type | Purpose | Example Value | Use Case |
|---|---|---|---|---|---|
| Time Range | timestamp | DateTime | Specify query time window | 2024-01-01 00:00:00 to 2024-01-02 00:00:00 | Issue time period location, performance analysis |
| Trace ID | traceId | String | Request tracing in distributed systems | 1234567890abcdef | Link tracing, request flow analysis |
| Span ID | spanId | String | Identifier for specific operations in traces | abcdef1234567890 | Microservice call analysis |
| Severity Number | severityNumber | Number | OpenTelemetry standard level | 1-24 | Filter by numeric level |
| Severity Text | severityText | String | Human-readable log level | ERROR, WARN, INFO | Quick filtering by level |
Visualization Analysis Charts
Visualization analysis charts include basic statistical indicator charts and aggregated statistical charts. Click the "Show Statistics" button to expand and view them.
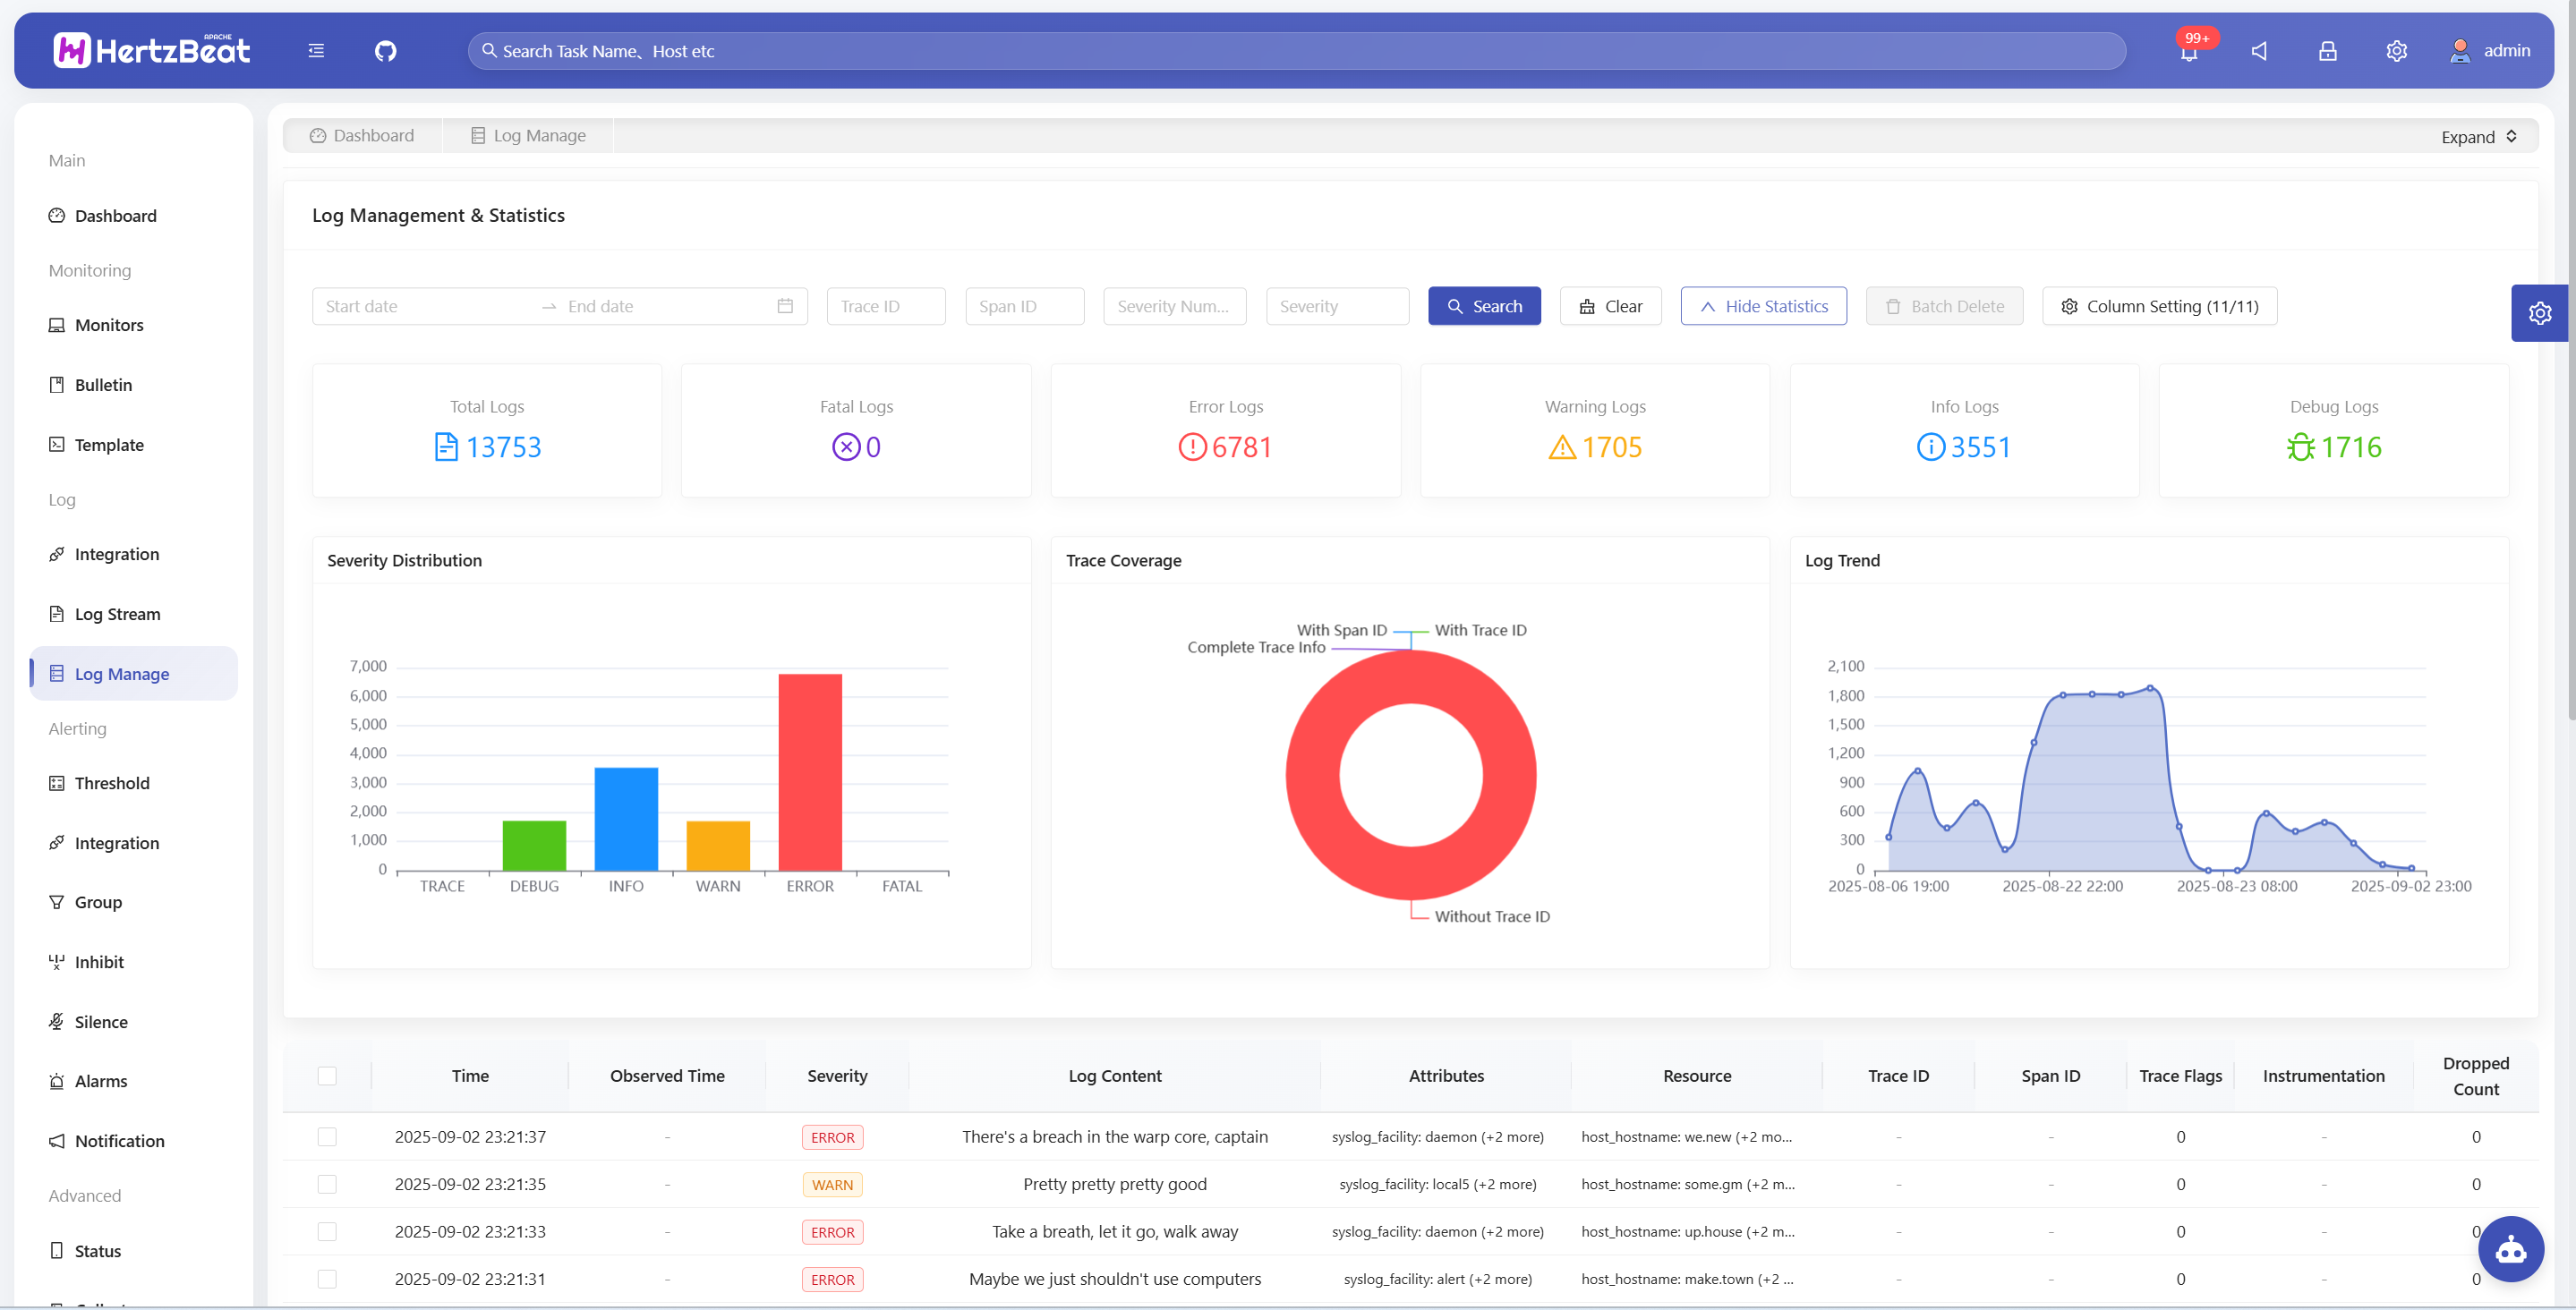
Basic Statistical Indicators
| Statistical Indicator | Description | Application Value | Anomaly Threshold Reference |
|---|---|---|---|
| Total Logs | Total number of logs matching query criteria | Evaluate system activity and data scale | Sudden increase/decrease over 50% needs attention |
| FATAL Logs | Fatal error level log statistics | Identify system critical failures | Any FATAL logs need immediate handling |
| ERROR Logs | Error level log statistics | Monitor system anomalies | Over 5% of total logs needs attention |
| WARN Logs | Warning level log statistics | Discover potential issues and performance bottlenecks | Continuous growth trend needs analysis |
| INFO Logs | Information level log statistics | Understand normal system operation status | Should be the main body of logs |
| DEBUG Logs | Debug level log statistics | Development debugging and issue troubleshooting | Should control quantity in production environment |
Aggregated Statistical Charts
| Chart Name | Chart Type | Display Content | Main Purpose | Included Metrics/Levels |
|---|---|---|---|---|
| Severity Distribution Chart | Pie chart | Quantity distribution of different log levels | Quickly understand log severity distribution | FATAL, ERROR, WARN, INFO, DEBUG |
| Trace Coverage Chart | Pie chart | Proportion of logs with trace information | Analyze system trace coverage | Number of logs with Trace ID Number of logs with Span ID Number of logs with both Trace and Span Number of logs without trace information |
| Log Trend Chart | Timeline chart | Hourly statistics of log quantity trends | Analyze log generation time patterns and anomaly peaks | Time granularity: Hourly statistics Analysis dimension: Time pattern recognition, anomaly peak detection |
Column Display Configuration
Click the "Column Settings" button to customize table column display:
- Time: Log generation timestamp
- Observed Time: Time when log was observed
- Severity: Log level label
- Log Content: Main message content
- Attributes: Log additional attribute information
- Resource: Resource-related information
- Trace ID: Distributed tracing identifier
- Span ID: Operation span identifier
- Trace Flags: Trace flag information
- Instrumentation Scope Info: Instrumentation scope information
- Dropped Count: Number of dropped attributes
Log Details View
Click any log entry in the table to open the details modal:
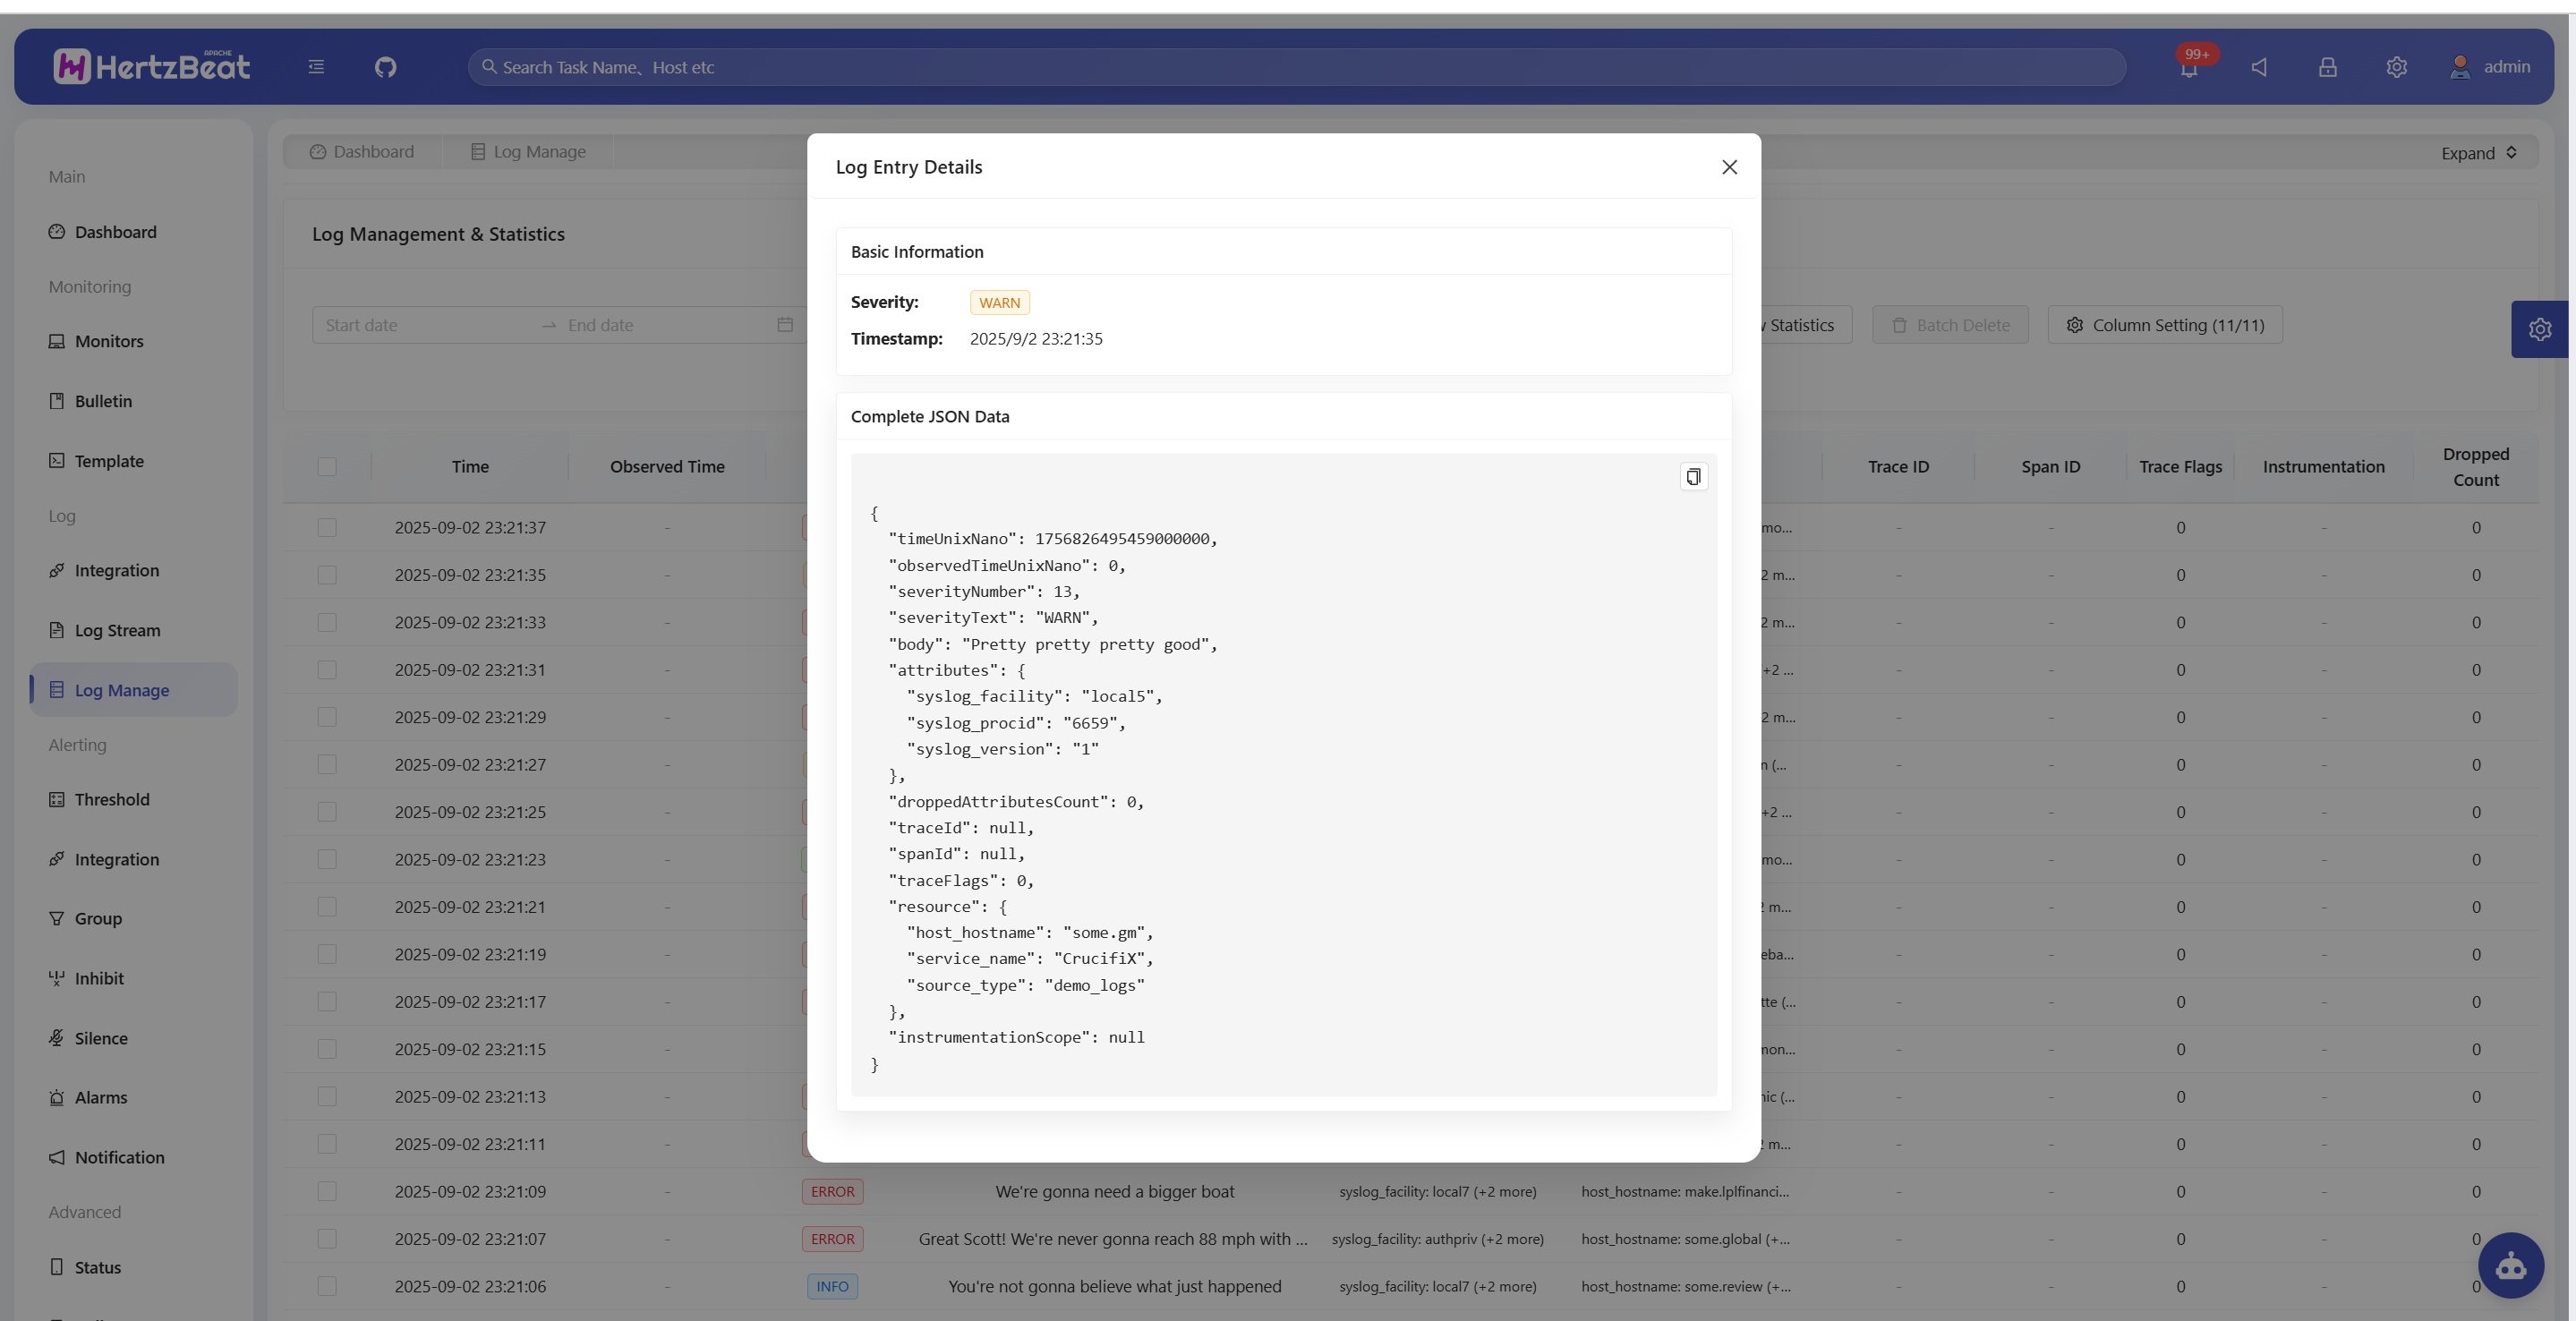
Basic Information Section
- Severity: Display level label and color identifier
- Timestamp: Formatted detailed time display
- Trace ID: Complete distributed tracing identifier
- Span ID: Complete operation span identifier
Complete JSON Data
- Raw Data: Display complete JSON format of log entry
- Copy Function: Support one-click copy to clipboard
- Formatted Display: JSON data is formatted for easy reading
Batch Delete Feature
- Select Logs: Use checkboxes on the left side of the table to select logs for deletion
- Select All: Use the checkbox in the table header to select all logs on the current page
- Batch Delete: Click the "Batch Delete" button to delete selected logs
- Delete Count: Button shows the number of currently selected logs
Troubleshooting
Unable to View Logs
Symptoms: Page shows "No Data" or loading failure Solutions:
- Check if time-series database is properly configured
- Confirm database service is running normally
- Verify database connection configuration is correct
- Check if log data is being written to the database
For more information about log management features or technical issues, feel free to engage with the community through GitHub Issues.