Log Stream (Beta)
HertzBeat's log stream feature provides real-time log viewing and filtering capabilities, including real-time log monitoring, multi-dimensional filtering, and log detail viewing. Users can monitor system logs in real-time and perform precise filtering based on different conditions to quickly locate issues and analyze system status.
The log stream feature is currently in Beta (experimental) stage. There may be potential defects and limitations. The feature is under active development and iteration.
Feature Overview
In the HertzBeat interface, navigate to "Log" -> "Log Stream" page, where you will see a comprehensive real-time log monitoring interface.
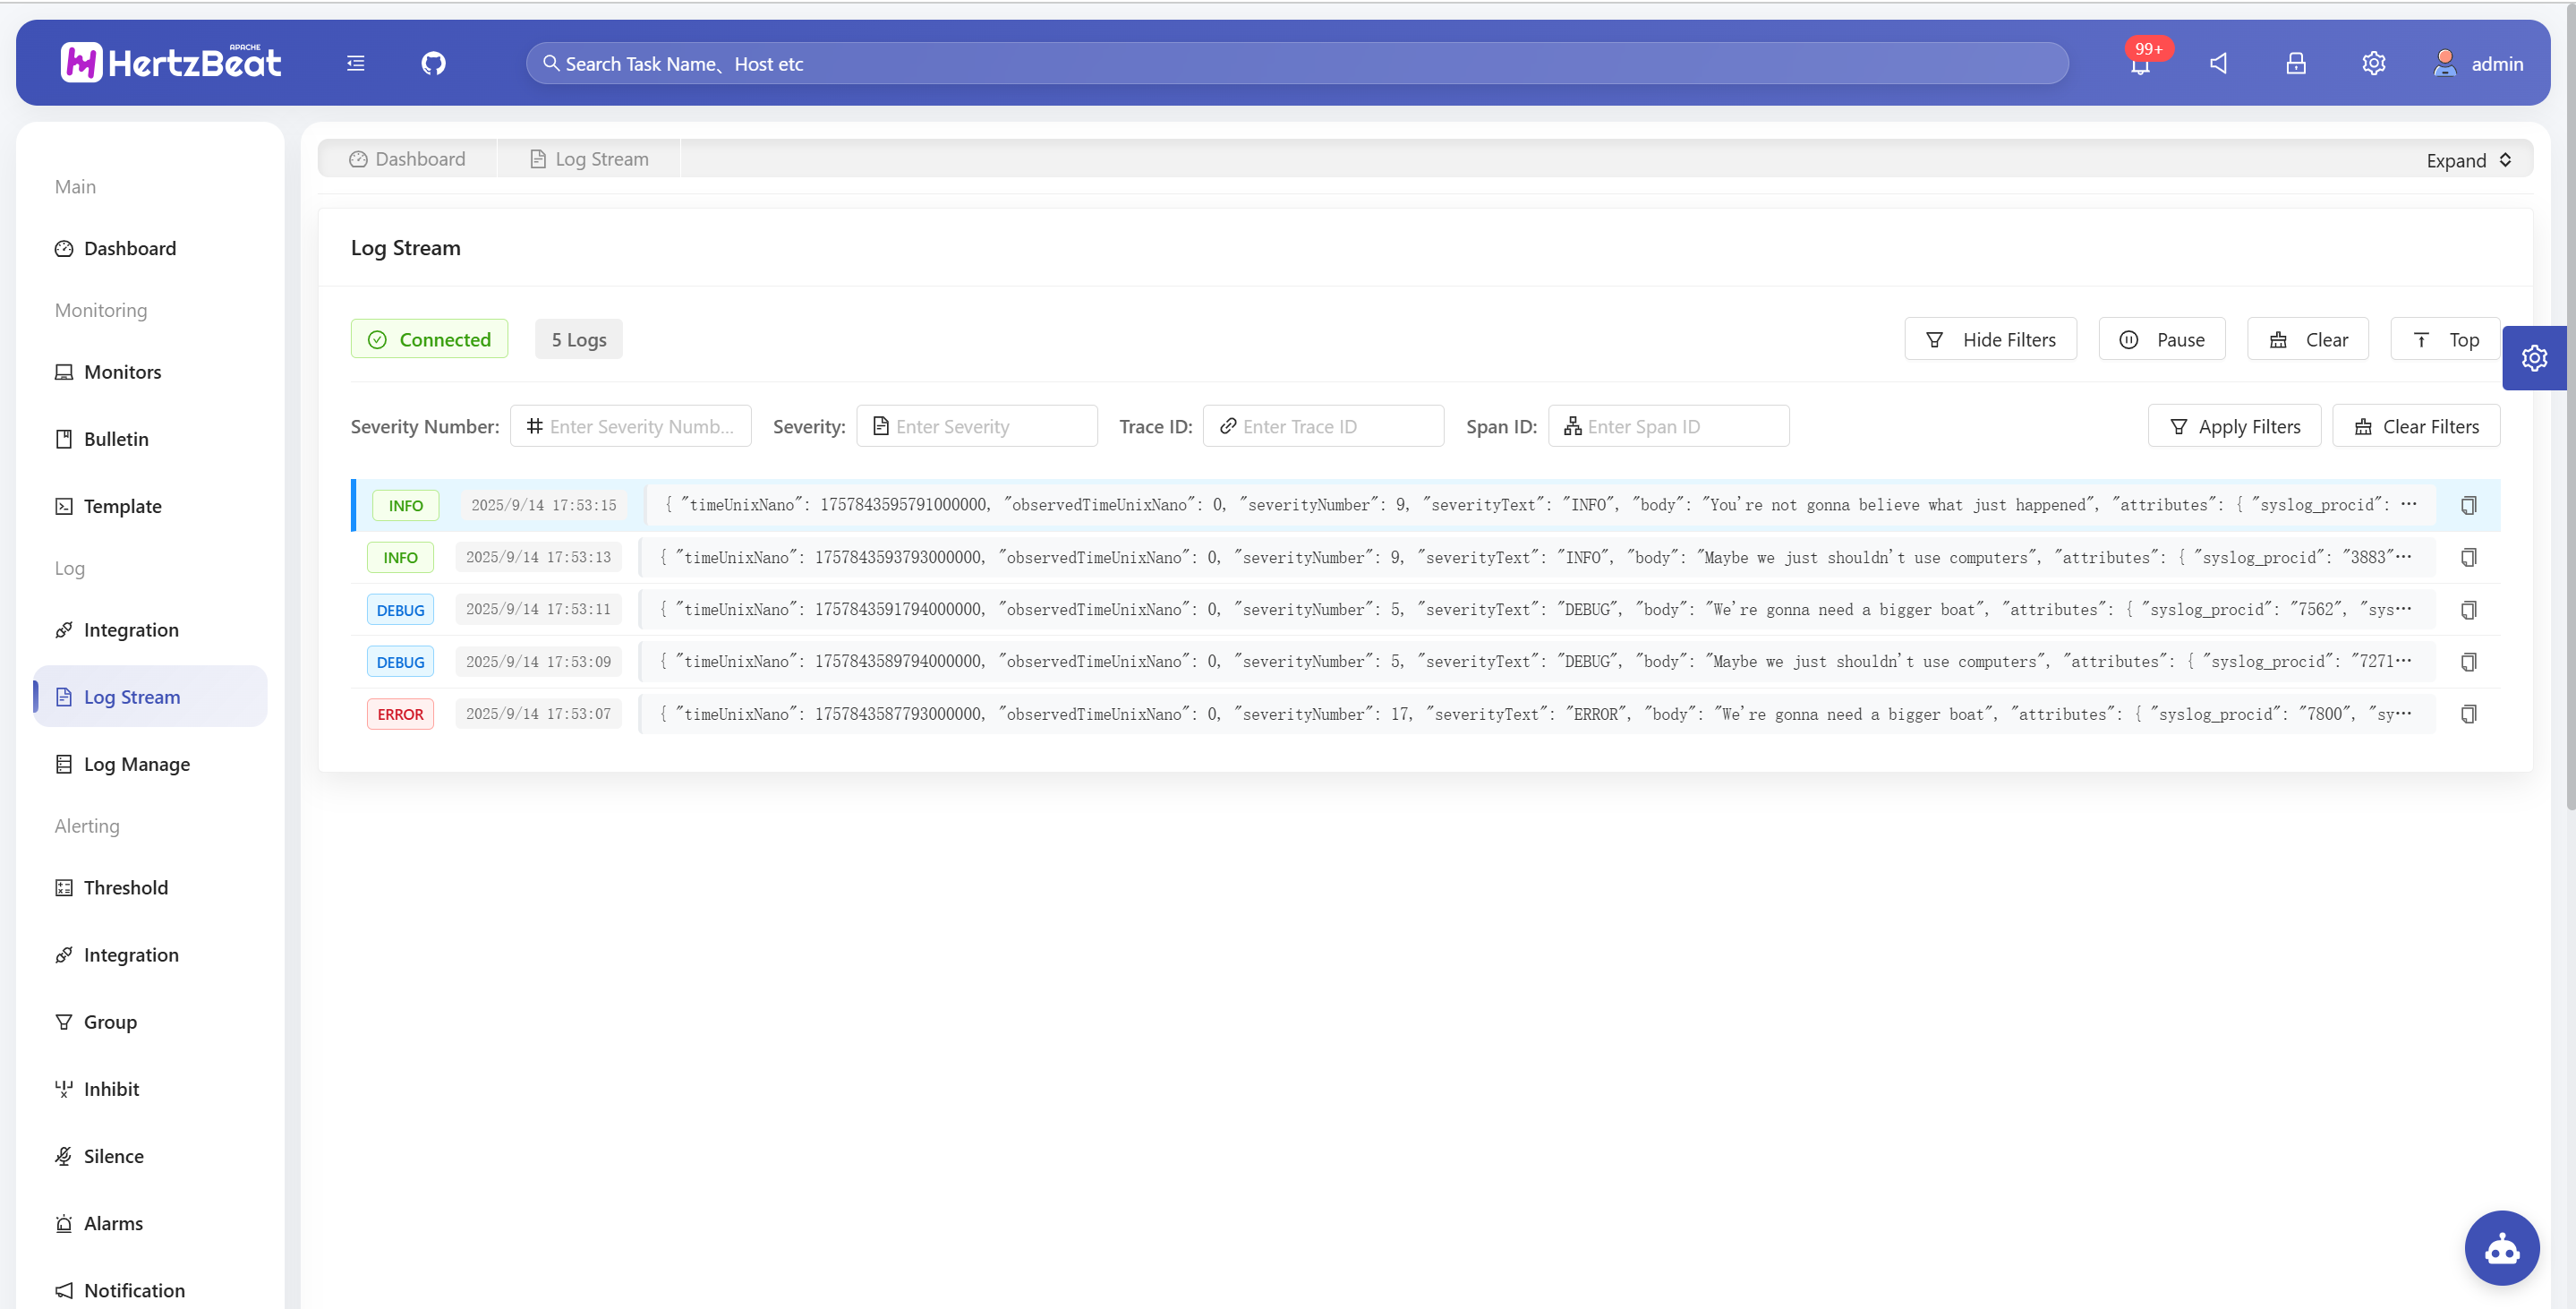
Real-time Log Viewing
Log Display
- Real-time Updates: New logs automatically appear at the top of the list with highlight animation effects
- Log Count: Interface displays the current number of loaded logs (maximum 1000 entries retained)
- Level Identification: Following OpenTelemetry specifications, different log levels are identified with different colors:
- Gray: TRACE (1-4)
- Blue: DEBUG (5-8)
- Green: INFO (9-12)
- Orange: WARN (13-16)
- Red: ERROR (17-20)
- Volcano Red: FATAL (21-24)
Display Controls
- Pause/Resume: Click the pause button to pause new log display, click again to resume
- Clear Logs: Clear all currently displayed log entries
- Scroll to Top: Quickly return to the latest log position
- Auto Scroll: System automatically scrolls to the latest logs by default. When users manually scroll to other positions, auto scroll will pause. Click "Scroll to Top" button or scroll to the top to re-enable auto scroll
Log Filtering
Click the "Show Filters" button to expand the filter configuration area, supporting the following filter conditions:
| Filter Condition | Field Name | Data Type | Purpose | Example Value | Use Case |
|---|---|---|---|---|---|
| Severity Number | severityNumber | Number | OpenTelemetry standard level | 9 | Filter by numeric level precisely |
| Severity Text | severityText | String | Human-readable log level | ERROR, WARN, INFO | Quick filtering by level |
| Trace ID | traceId | String | Distributed system request chain tracking | 1234567890abcdef | Trace analysis, request flow analysis |
| Span ID | spanId | String | Specific operation identifier within traces | abcdef1234567890 | Microservice call analysis |
Log Detail Viewing Features
Click any log entry to open the detail modal, providing complete log information display:
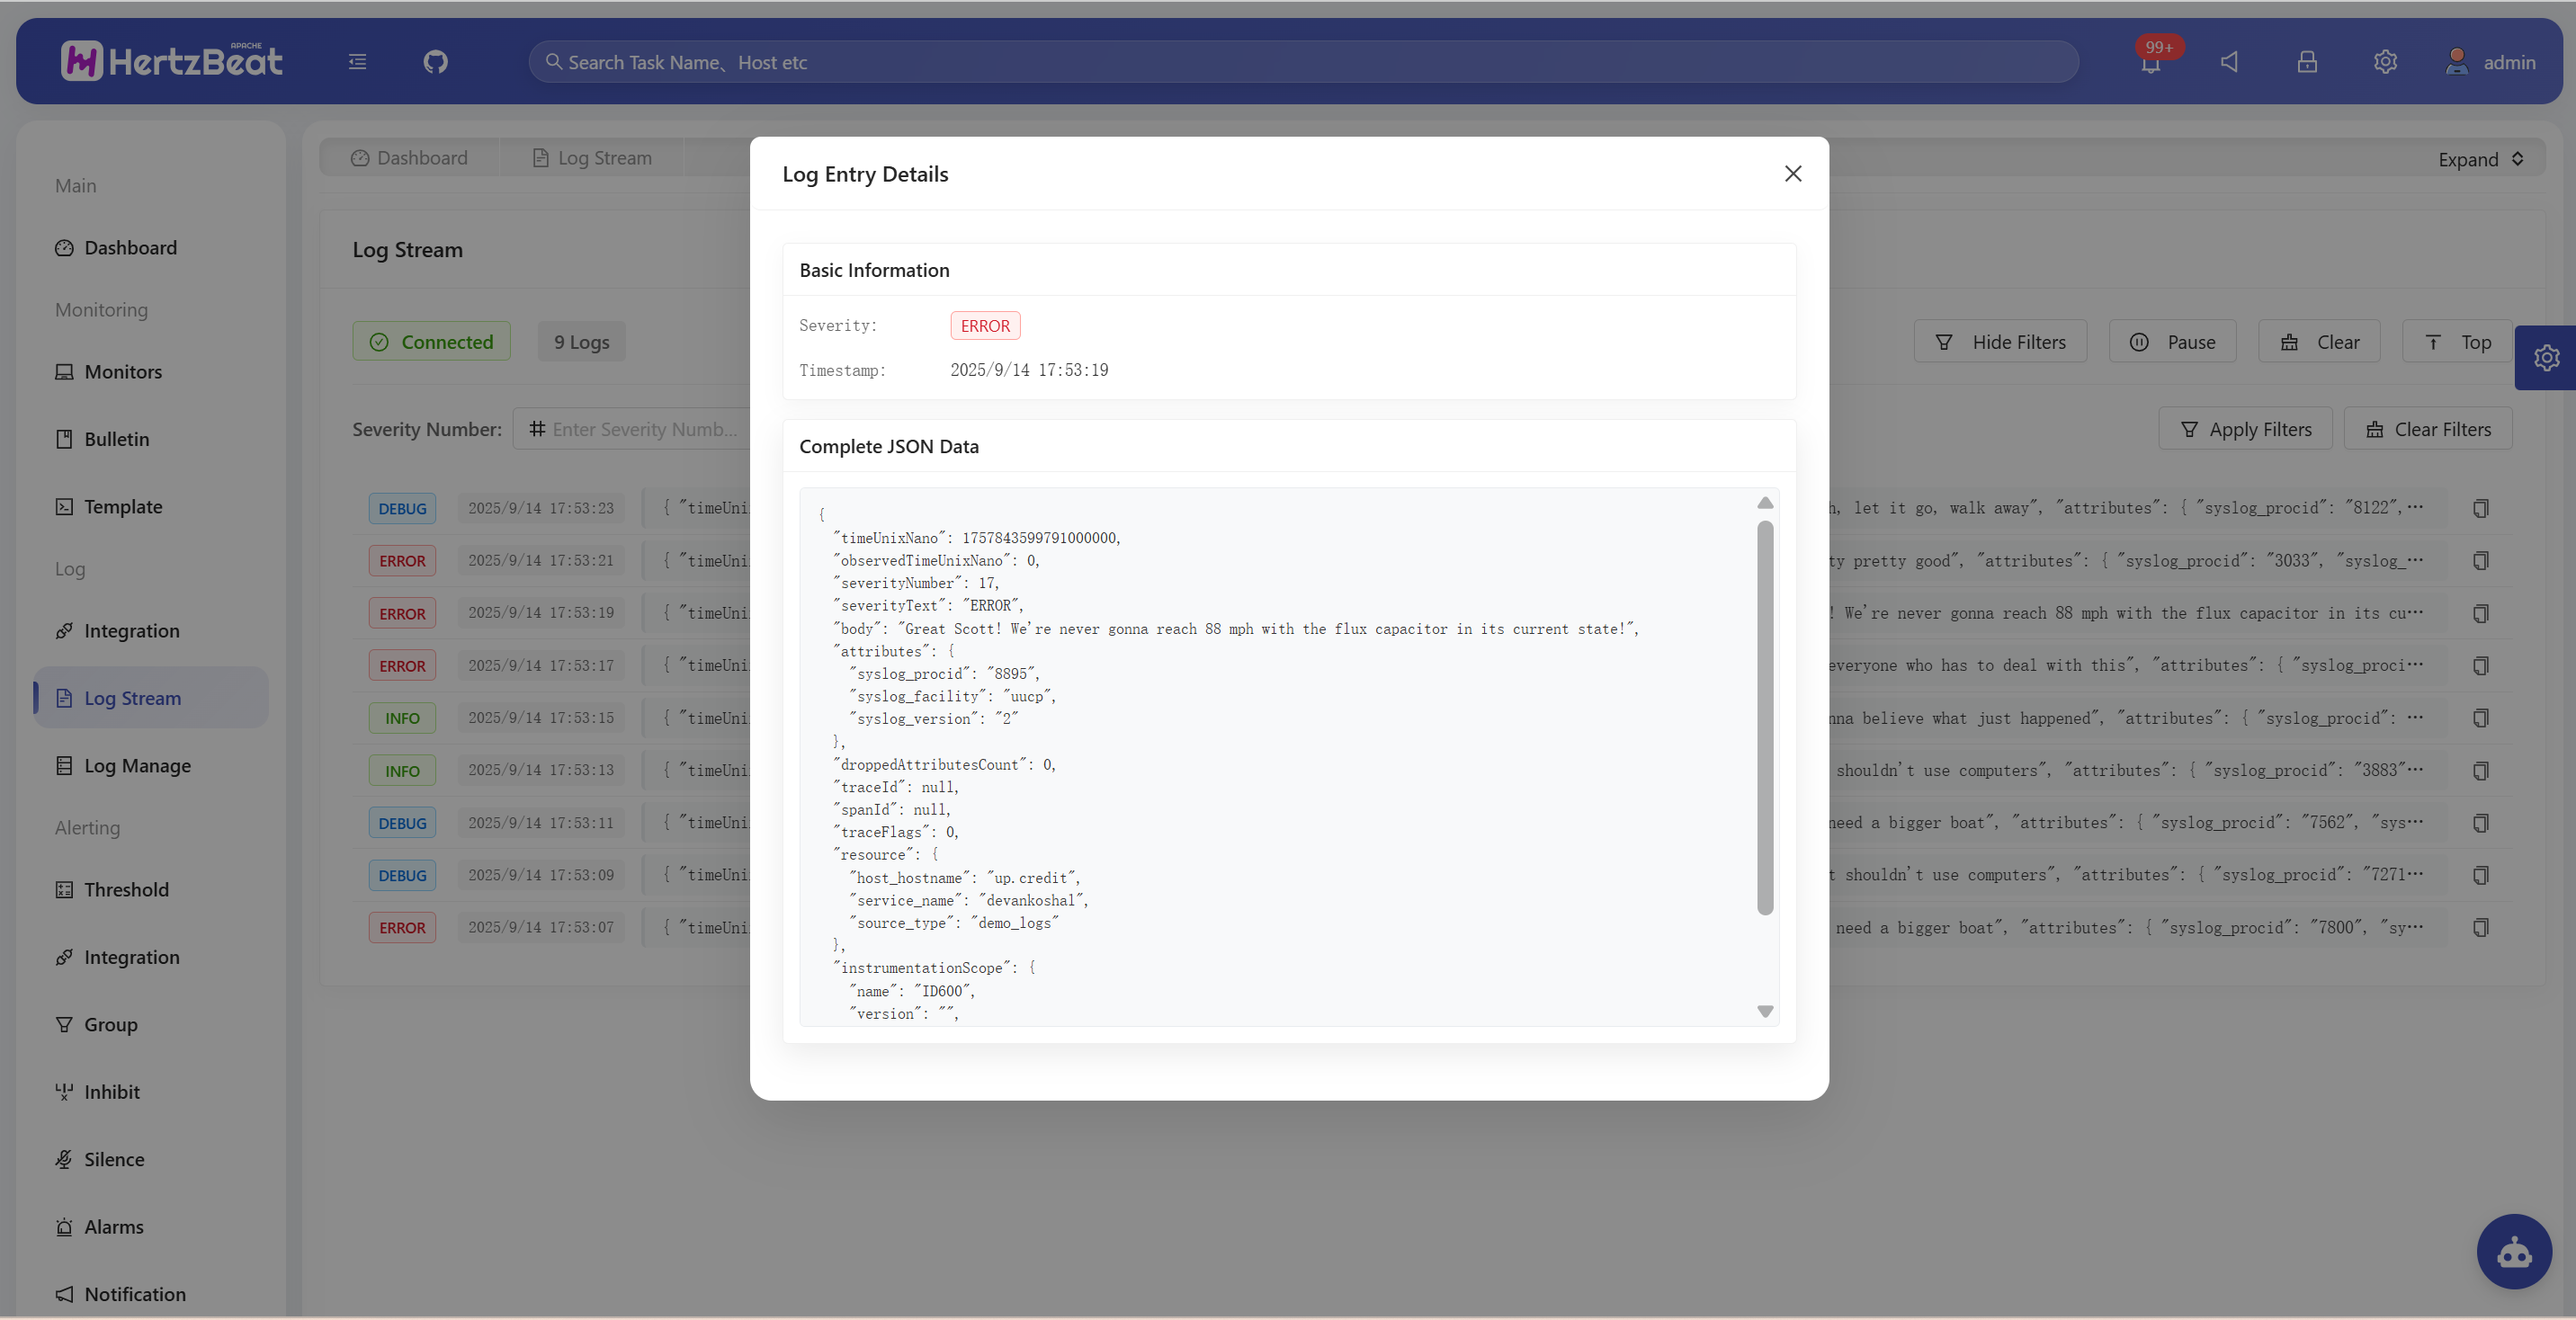
Basic Information Area
- Severity Level: Display level label and color identification
- Timestamp: Formatted detailed time display
- Trace ID: Complete distributed trace identifier
- Span ID: Complete operation span identifier
Complete JSON Data
- Raw Data: Display complete JSON format of the log entry
- Copy Function: Support one-click copy to clipboard
- Formatted Display: JSON data is formatted for easy reading
Troubleshooting
Connection Issues
Symptoms: Shows "Disconnected" status Solutions:
- Check network connection
- Confirm HertzBeat service is running normally
- Check if browser supports SSE
No Log Display
Symptoms: Connection is normal but no logs are displayed Solutions:
- Check if log data is being sent to HertzBeat
- Verify filter settings are not too restrictive
- Confirm log format meets expectations
For more information about log stream features or technical issues, feel free to communicate with the community through GitHub Issues.