Linux Operating System Monitoring Practice
This article describes how to use the HertzBeat monitoring system to collect and monitor general performance metrics for Linux operating systems, and send us alert messages when file system usage is too high.
What's HertzBeat
Apache HertzBeat™ is a real-time monitoring tool with powerful custom monitoring capabilities without Agent. Website monitoring, port availability, database, operating system, threshold alarms, alarm notification (email, WeChat, DingTalk, Feishu).
github: https://github.com/apache/hertzbeat
Install
-
The
dockerenvironment can be installed with just one commanddocker run -d -p 1157:1157 -p 1158:1158 --name hertzbeat apache/hertzbeat -
After the installation is successful, the browser can access
http://ip:1157to start, the default account password isadmin/hertzbeat.
The production environment recommends a complete deployment method, refer Install HertzBeat via Docker Compose
Monitoring Linux Operating System
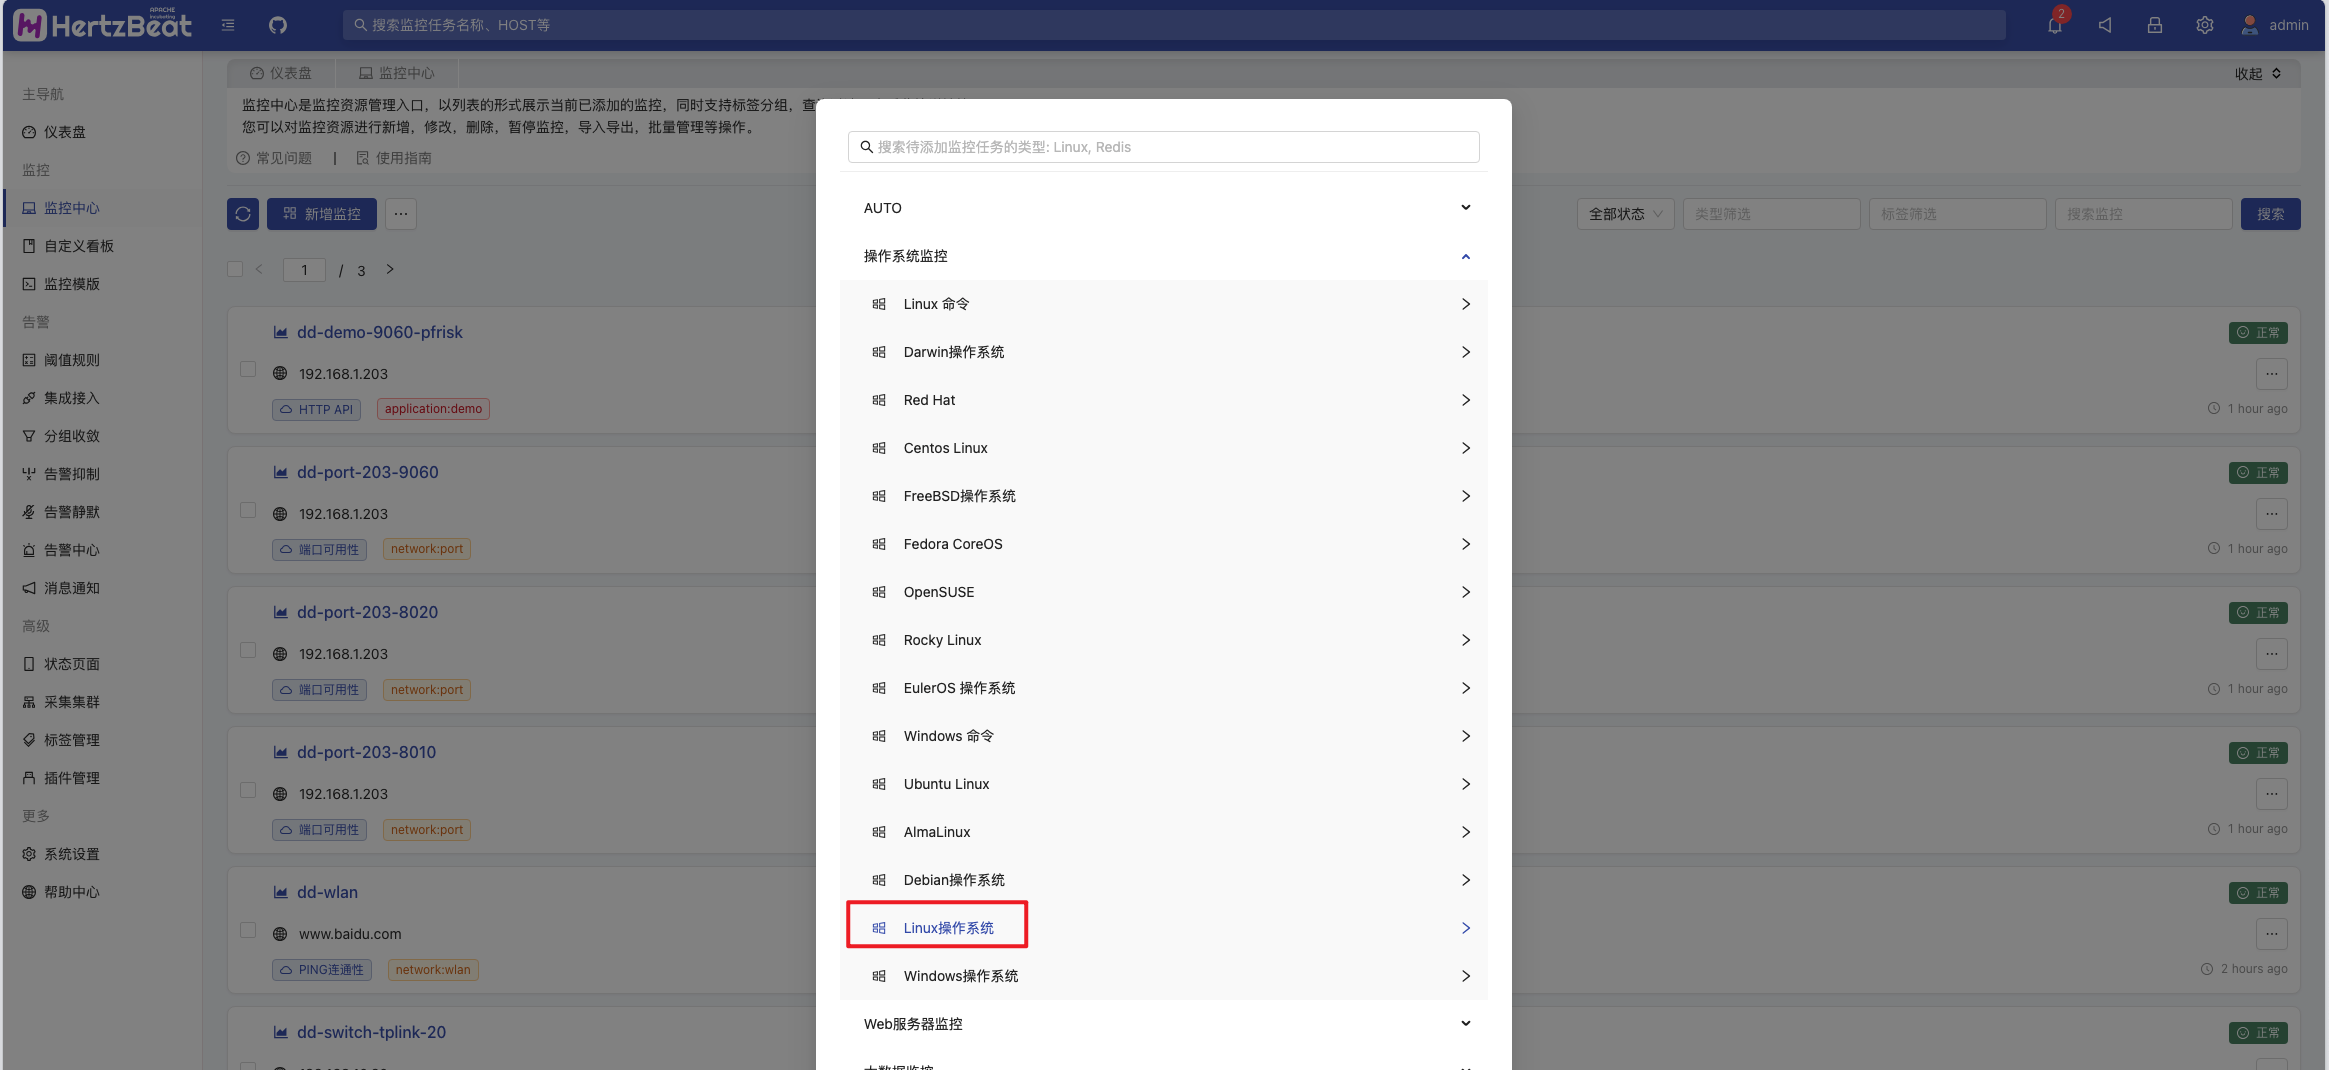
1. Click Add Linux Operating System Monitor
HertzBeat Page -> Monitors -> New Monitor -> OS Monitor -> Add OS Linux
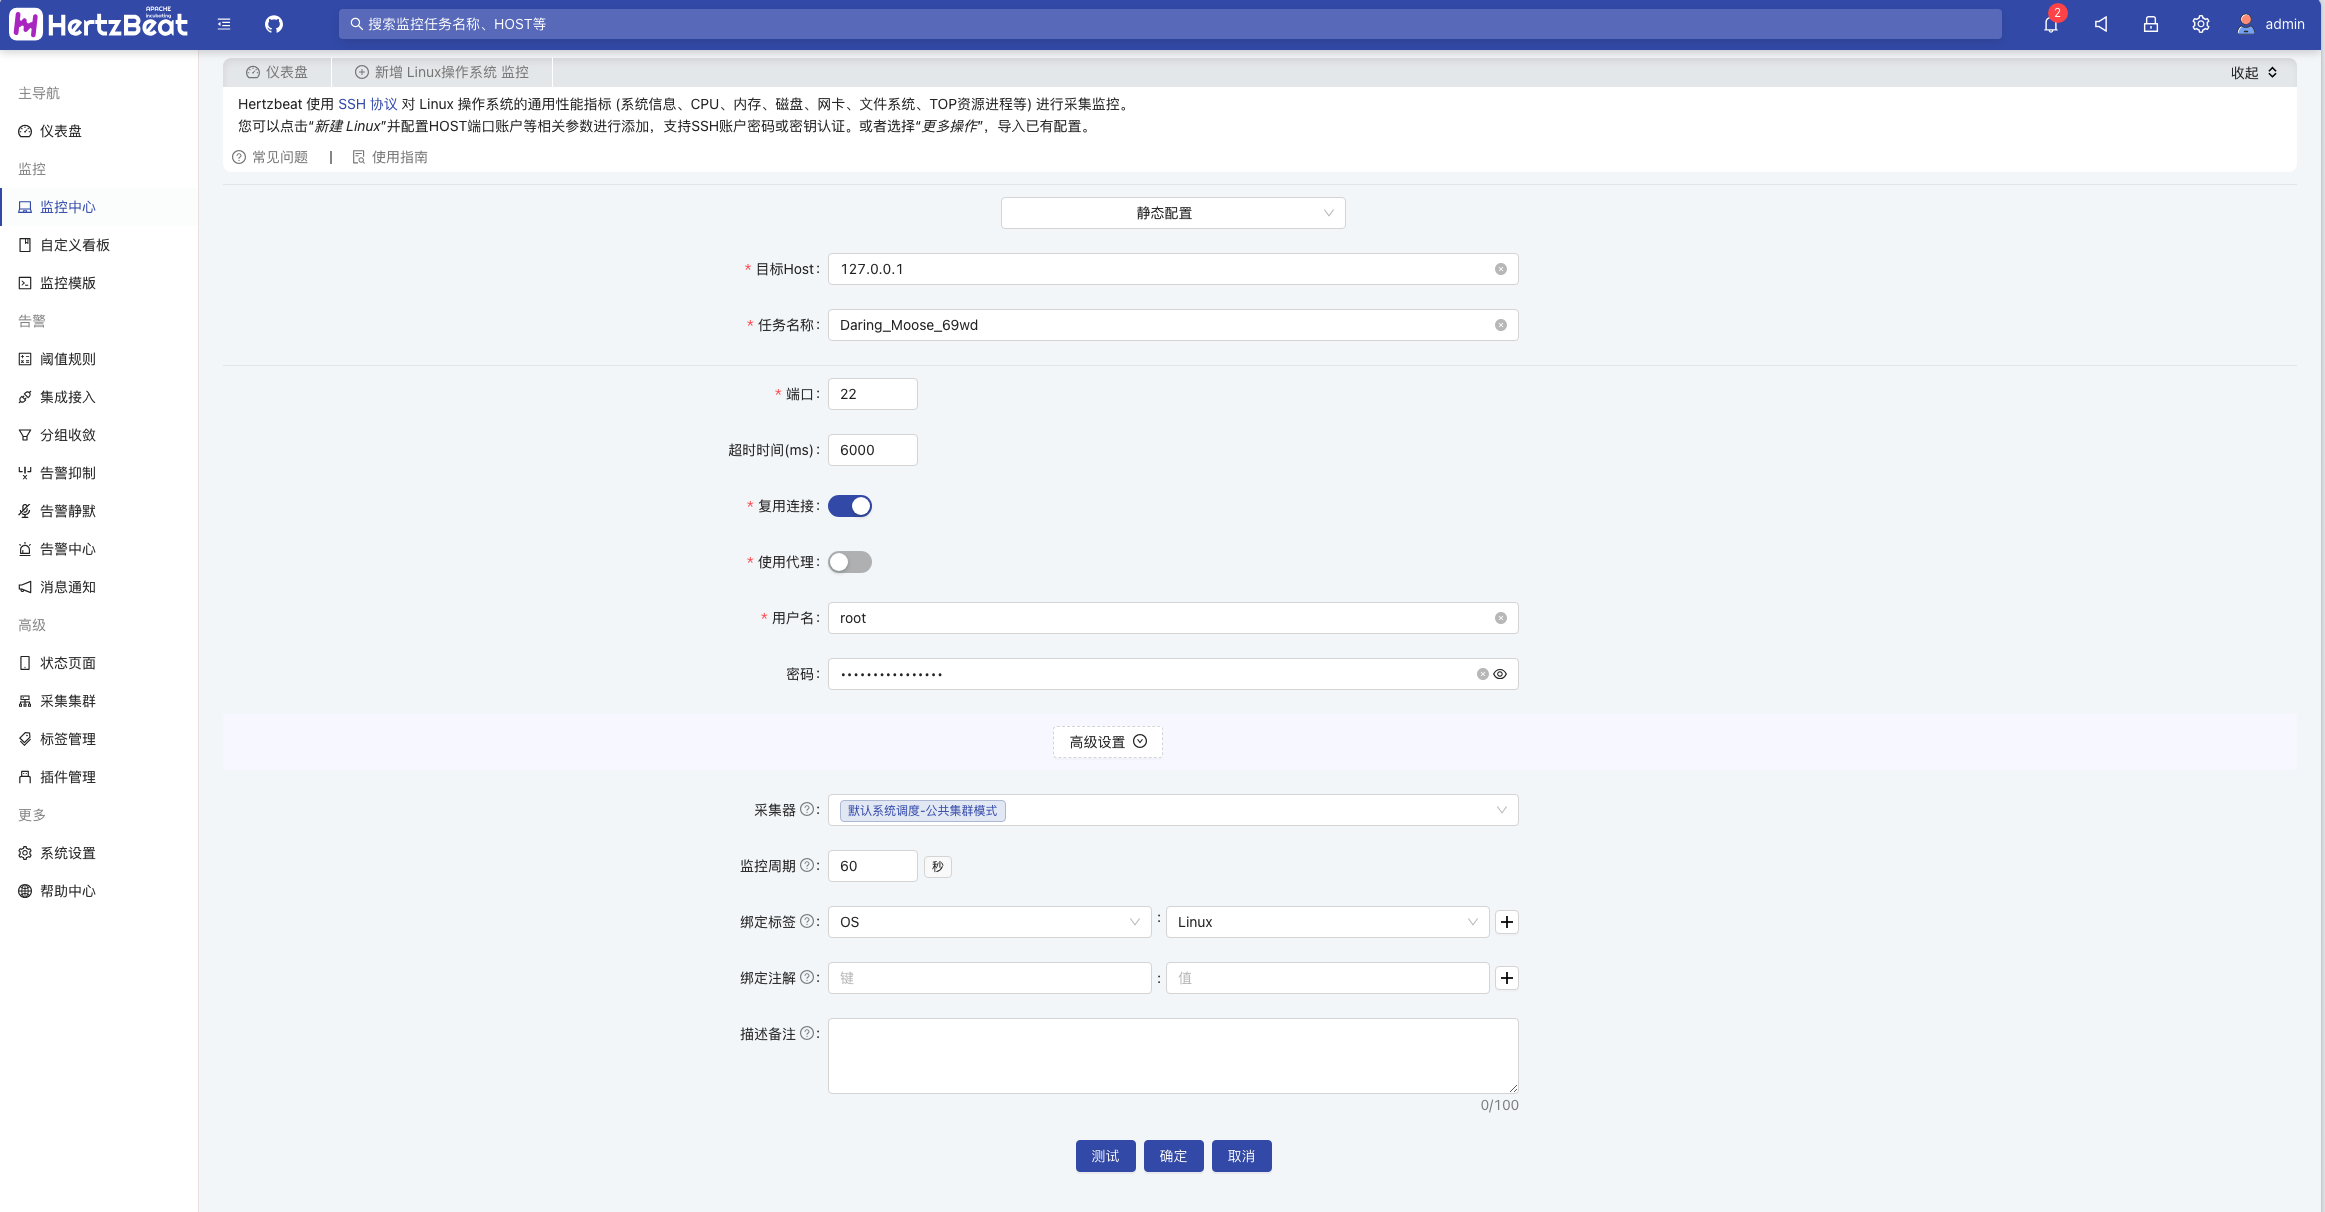
2. Configure the monitoring parameters
- Target Host:The IPV4, IPV6, or domain name of the host being monitored. No protocol header (e.g., https://, http://).
- Port:The port provided by Linux SSH, default is 22.
- Timeout:Sets the connection timeout in milliseconds, default is 6000 ms.
- Reuse Connection: Sets whether SSH connections are reused, default is :false. If false, a new connection is created each time information is retrieved.
- Username: SSH connection username
- Password: SSH connection password, optional.
For more parameters and advanced settings, please refer to the help documentation: Monitoring:Linux operating system monitoring
Tasks can be managed using label classification, such as adding bind labels like OS=Linux.
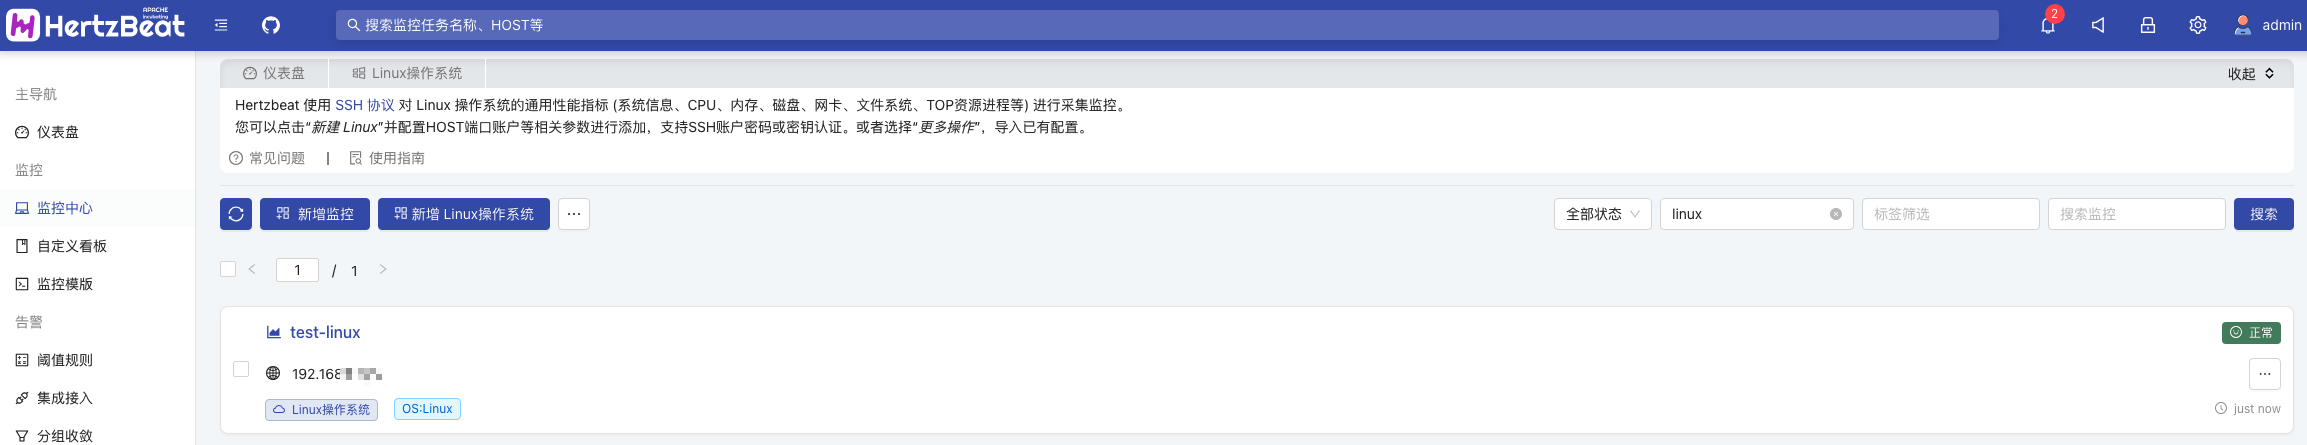
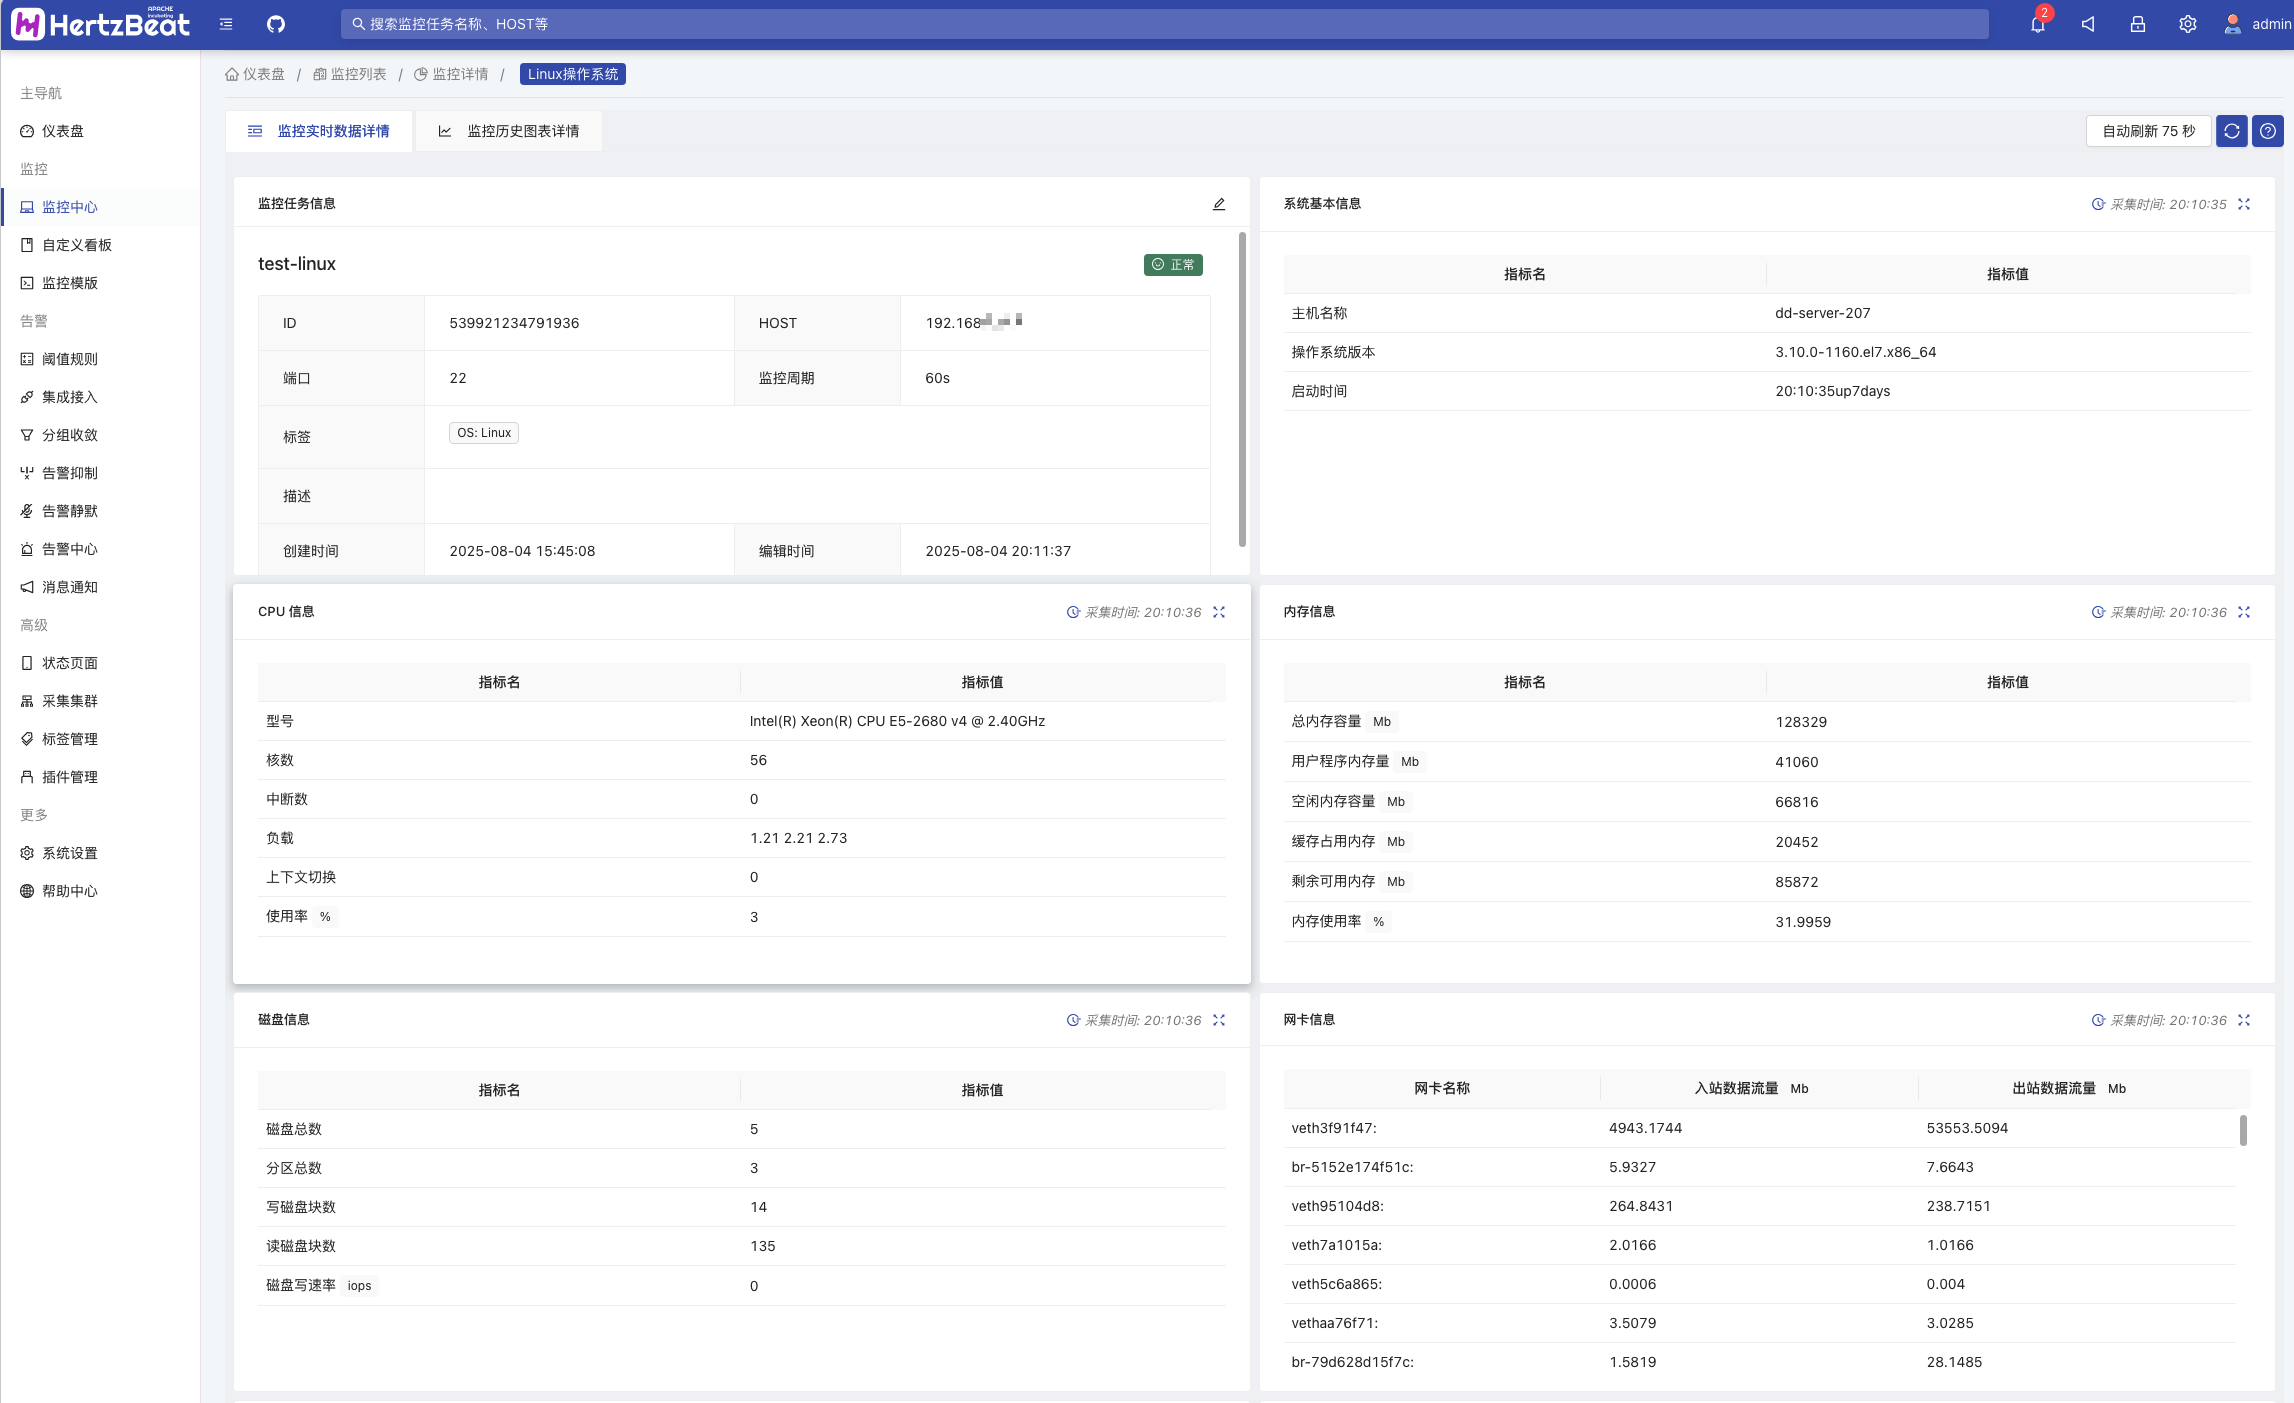
3. View the detection index data
In the monitoring list, you can view the monitoring status, and in the monitoring details, you can view the metric data chart, etc.
4. Set the threshold
Here, we set a threshold rule to trigger an alert when the usage rate of a certain directory in the file system is too high.
HertzBeat Page -> Alerting -> Threshold -> New Threshold -> RealTime Threshold Rule
Configure the threshold, configure the alarm expression-triggered when the metric
Disk Usagegreater than or equal to50%,set the alarm level notification template information, etc.
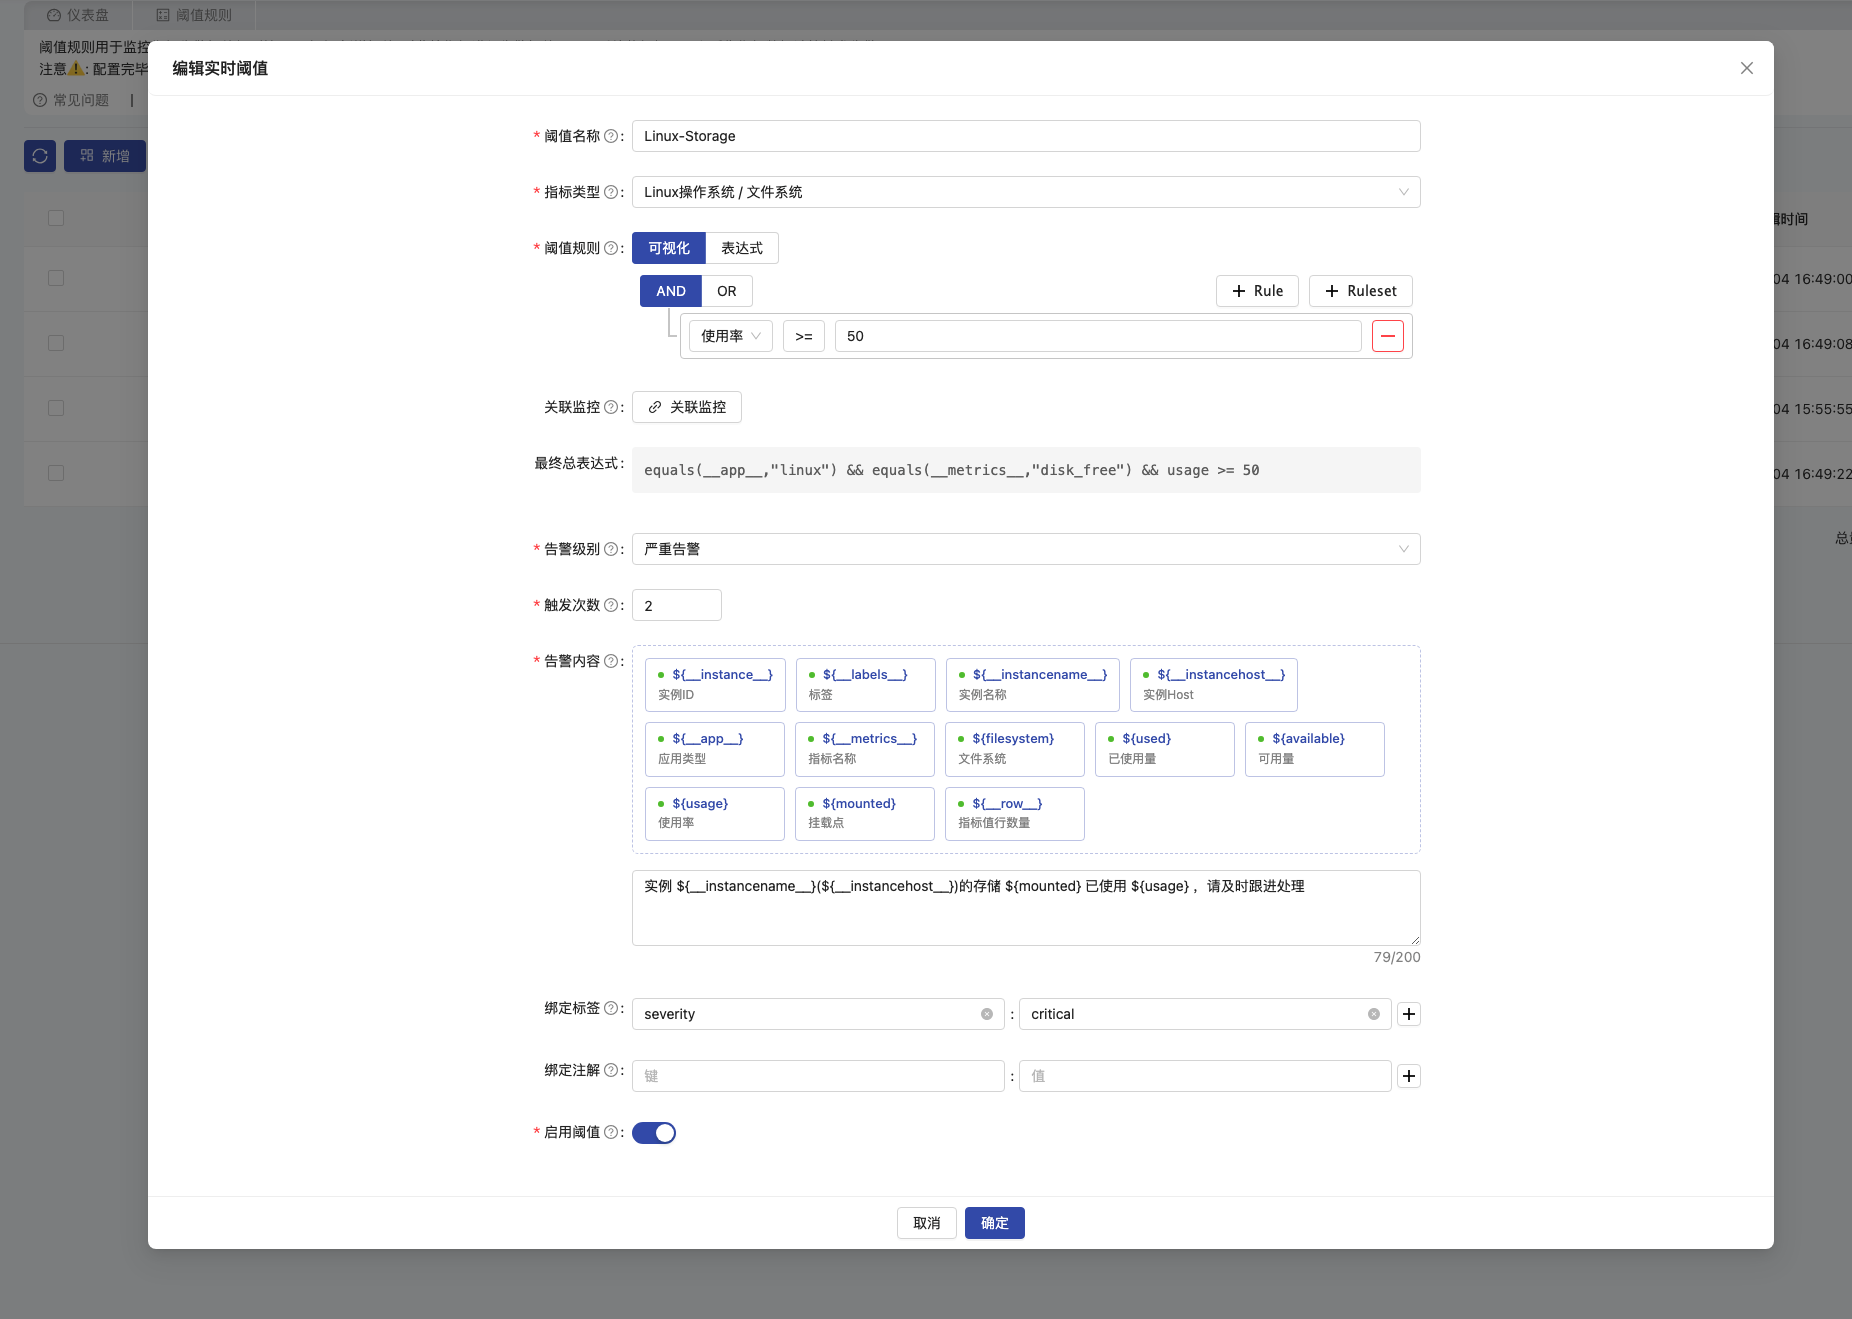
Threshold rule has others function you can try e.g., associating thresholds with monitoring, trigger times so on.
Finally, you can see the triggered alarm in the alarm center.

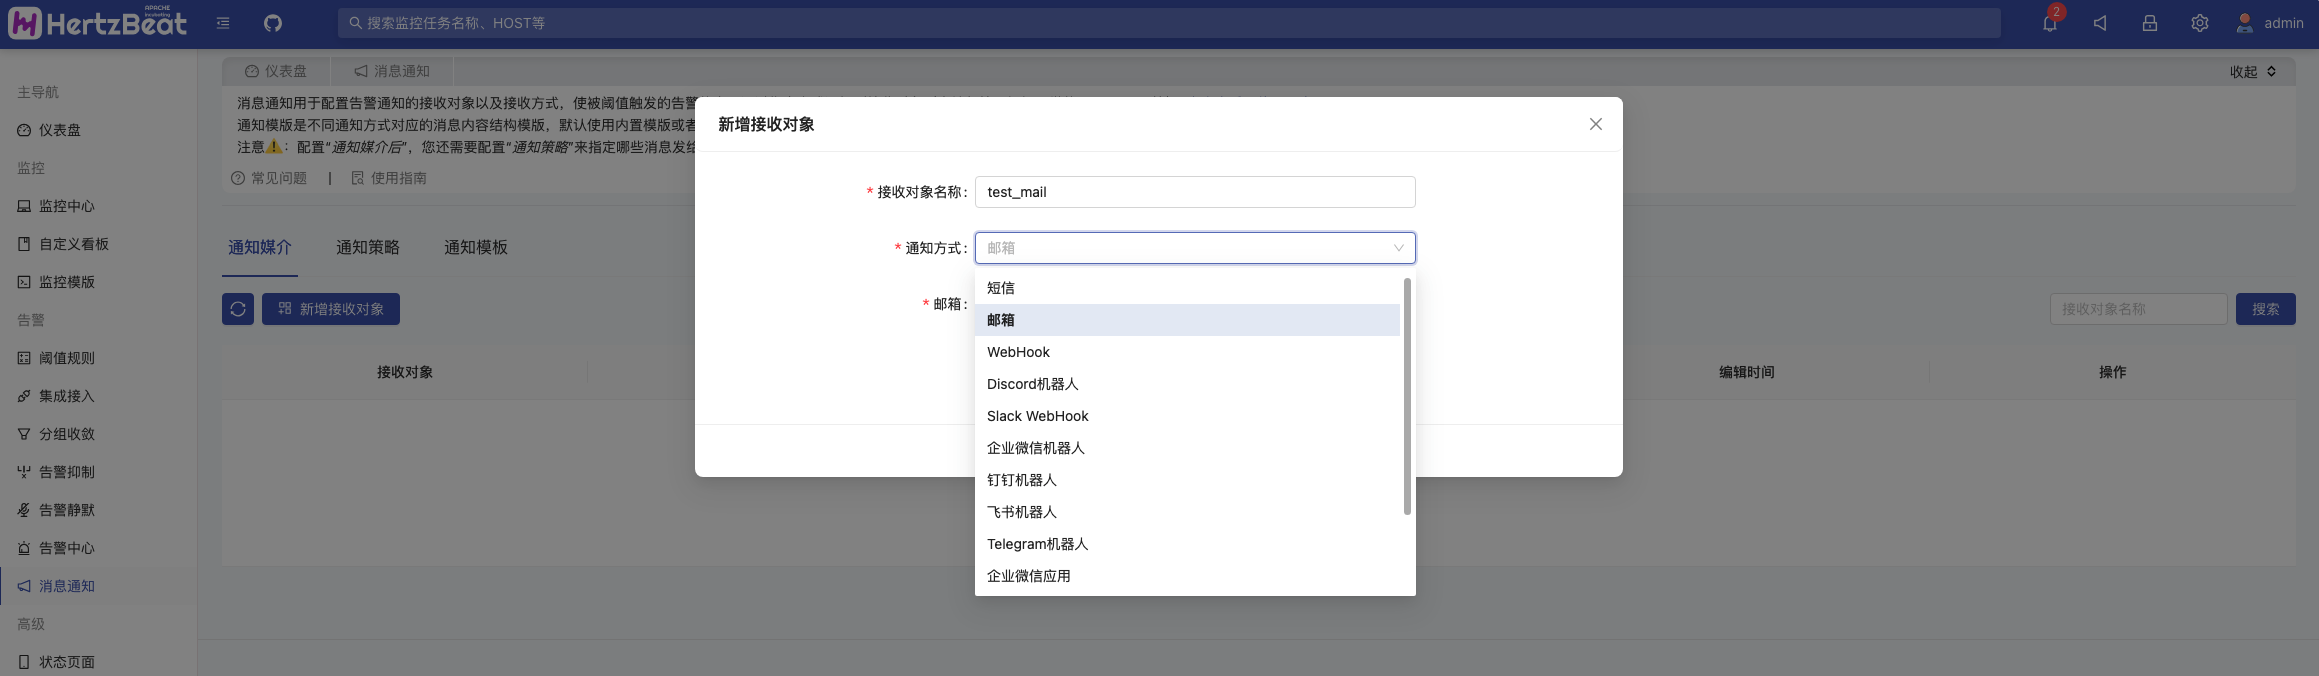
5. Alarm notification
HertzBeat Page -> Notification -> Notice Receiver -> New Receiver -> Configure the Email Receiver
HertzBeat Page -> Notification -> Notice Policy -> New Notice Policy -> Enable Notification for the Recipient Just Configured
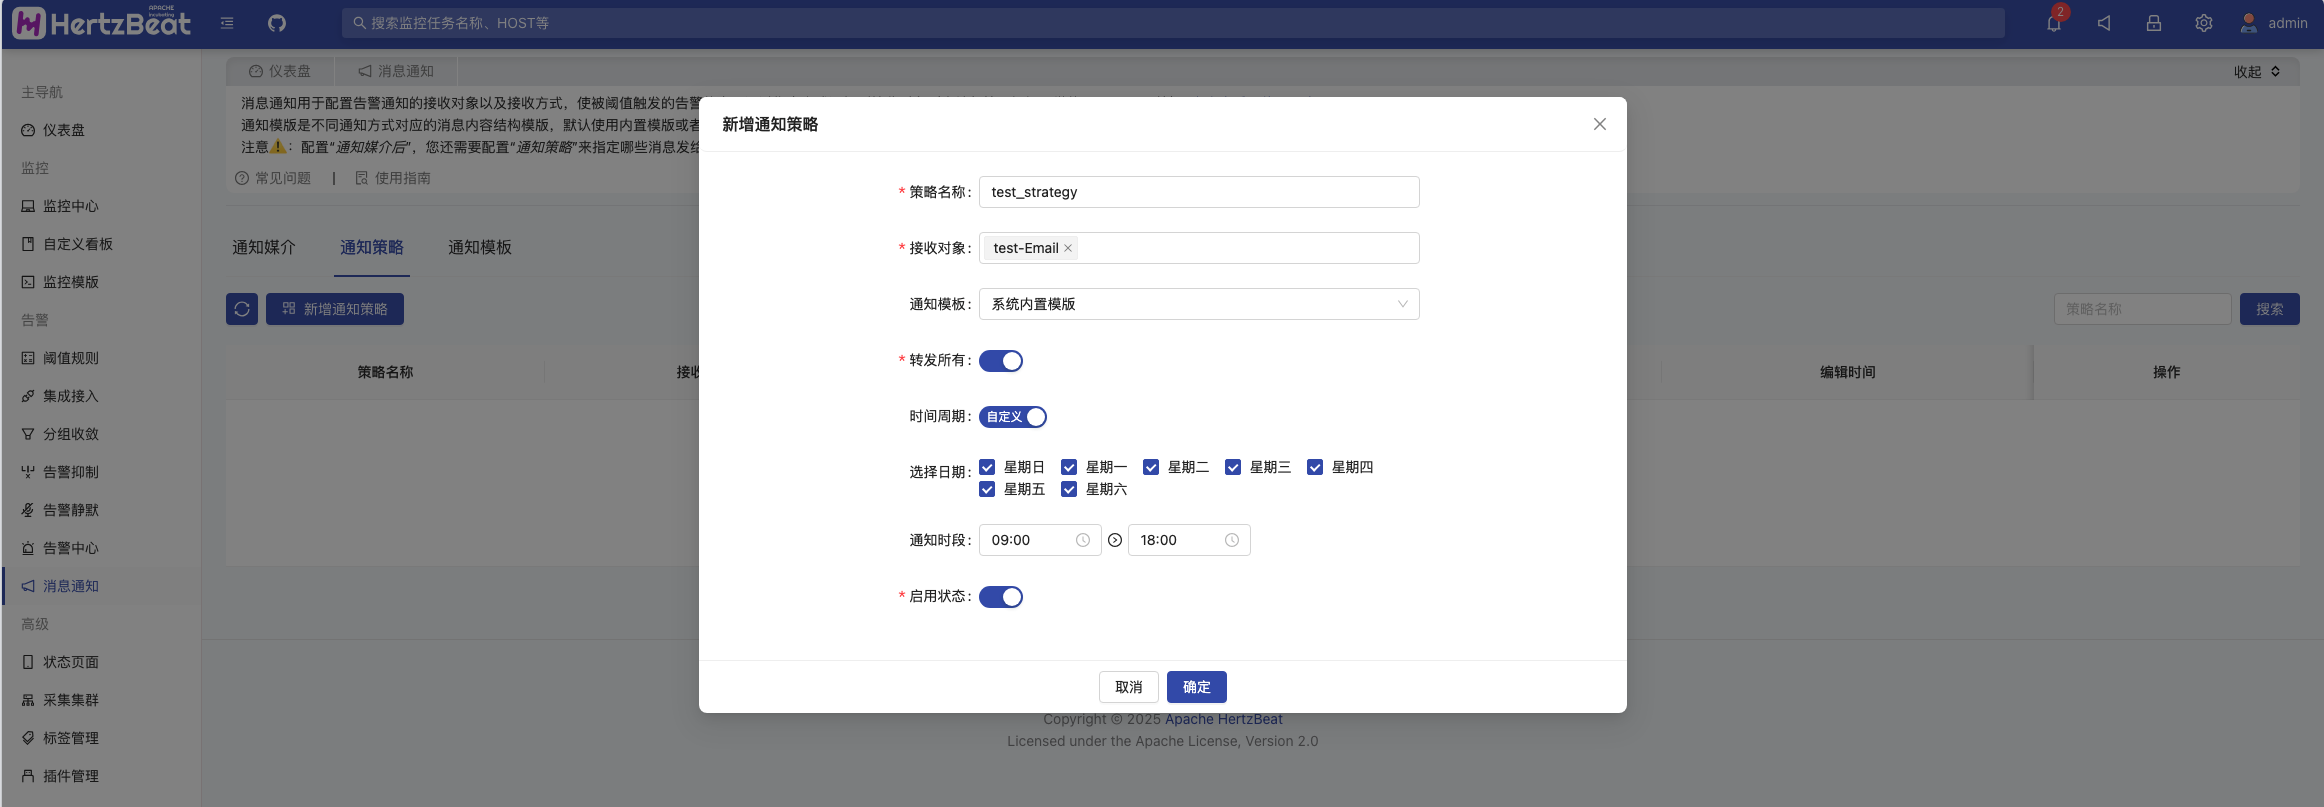
When the threshold is triggered, we can receive the corresponding alarm message. If there is no notification, you can also view the alarm information in the alarm center.
Summary
The practice of monitoring linux operating system is here. Of course, for HertzBeat, this function is just the tip of the iceberg. If you think HertzBeat is a good open source project, please give us a Star on GitHub, thanks for your support.