TDengine Monitoring Practice
TDengine TSDB is an open-source, high-performance, cloud-native time series database (TSDB) optimized for IoT, vehicle networking, industrial Internet, finance, IT operations, and other scenarios. It also comes with built-in caching, streaming computing, data subscription, and other system functions that greatly reduce system design complexity and lower R&D and operational costs, making it an extremely simple time series data processing platform.
This article introduces how to use the HertzBeat monitoring system to collect and monitor TDengine general performance indicators.
What is HertzBeat?
Apache HertzBeat™ is a real-time monitoring tool with powerful customization capabilities that does not require an agent. It monitors websites, PING connectivity, port availability, databases, operating systems, middleware, APIs, threshold alerts, and alert notifications (email, WeChat, DingTalk, Feishu).
Install HertzBeat
-
The
dockerenvironment can be installed with just one command.docker run -d -p 1157:1157 -p 1158:1158 --name hertzbeat apache/hertzbeat -
Once installed, you can start by accessing
localhost:1157in your browser. The default username and password areadmin/hertzbeat.
Recommended deployment method for production environments, reference: https://hertzbeat.apache.org/docs/start/docker-compose-deploy
Enable TDengine monitoring
TDengine TSDB integrates multiple monitoring metric collection mechanisms and aggregates them through taosKeeper. taosKeeper is a monitoring metric export tool for TDengine TSDB version 3.0. With just a few simple configurations, you can obtain the runtime status of TDengine TSDB. For reference: https://docs.taosdata.com/reference/components/taoskeeper/
Monitor TDengine(PromQL)
-
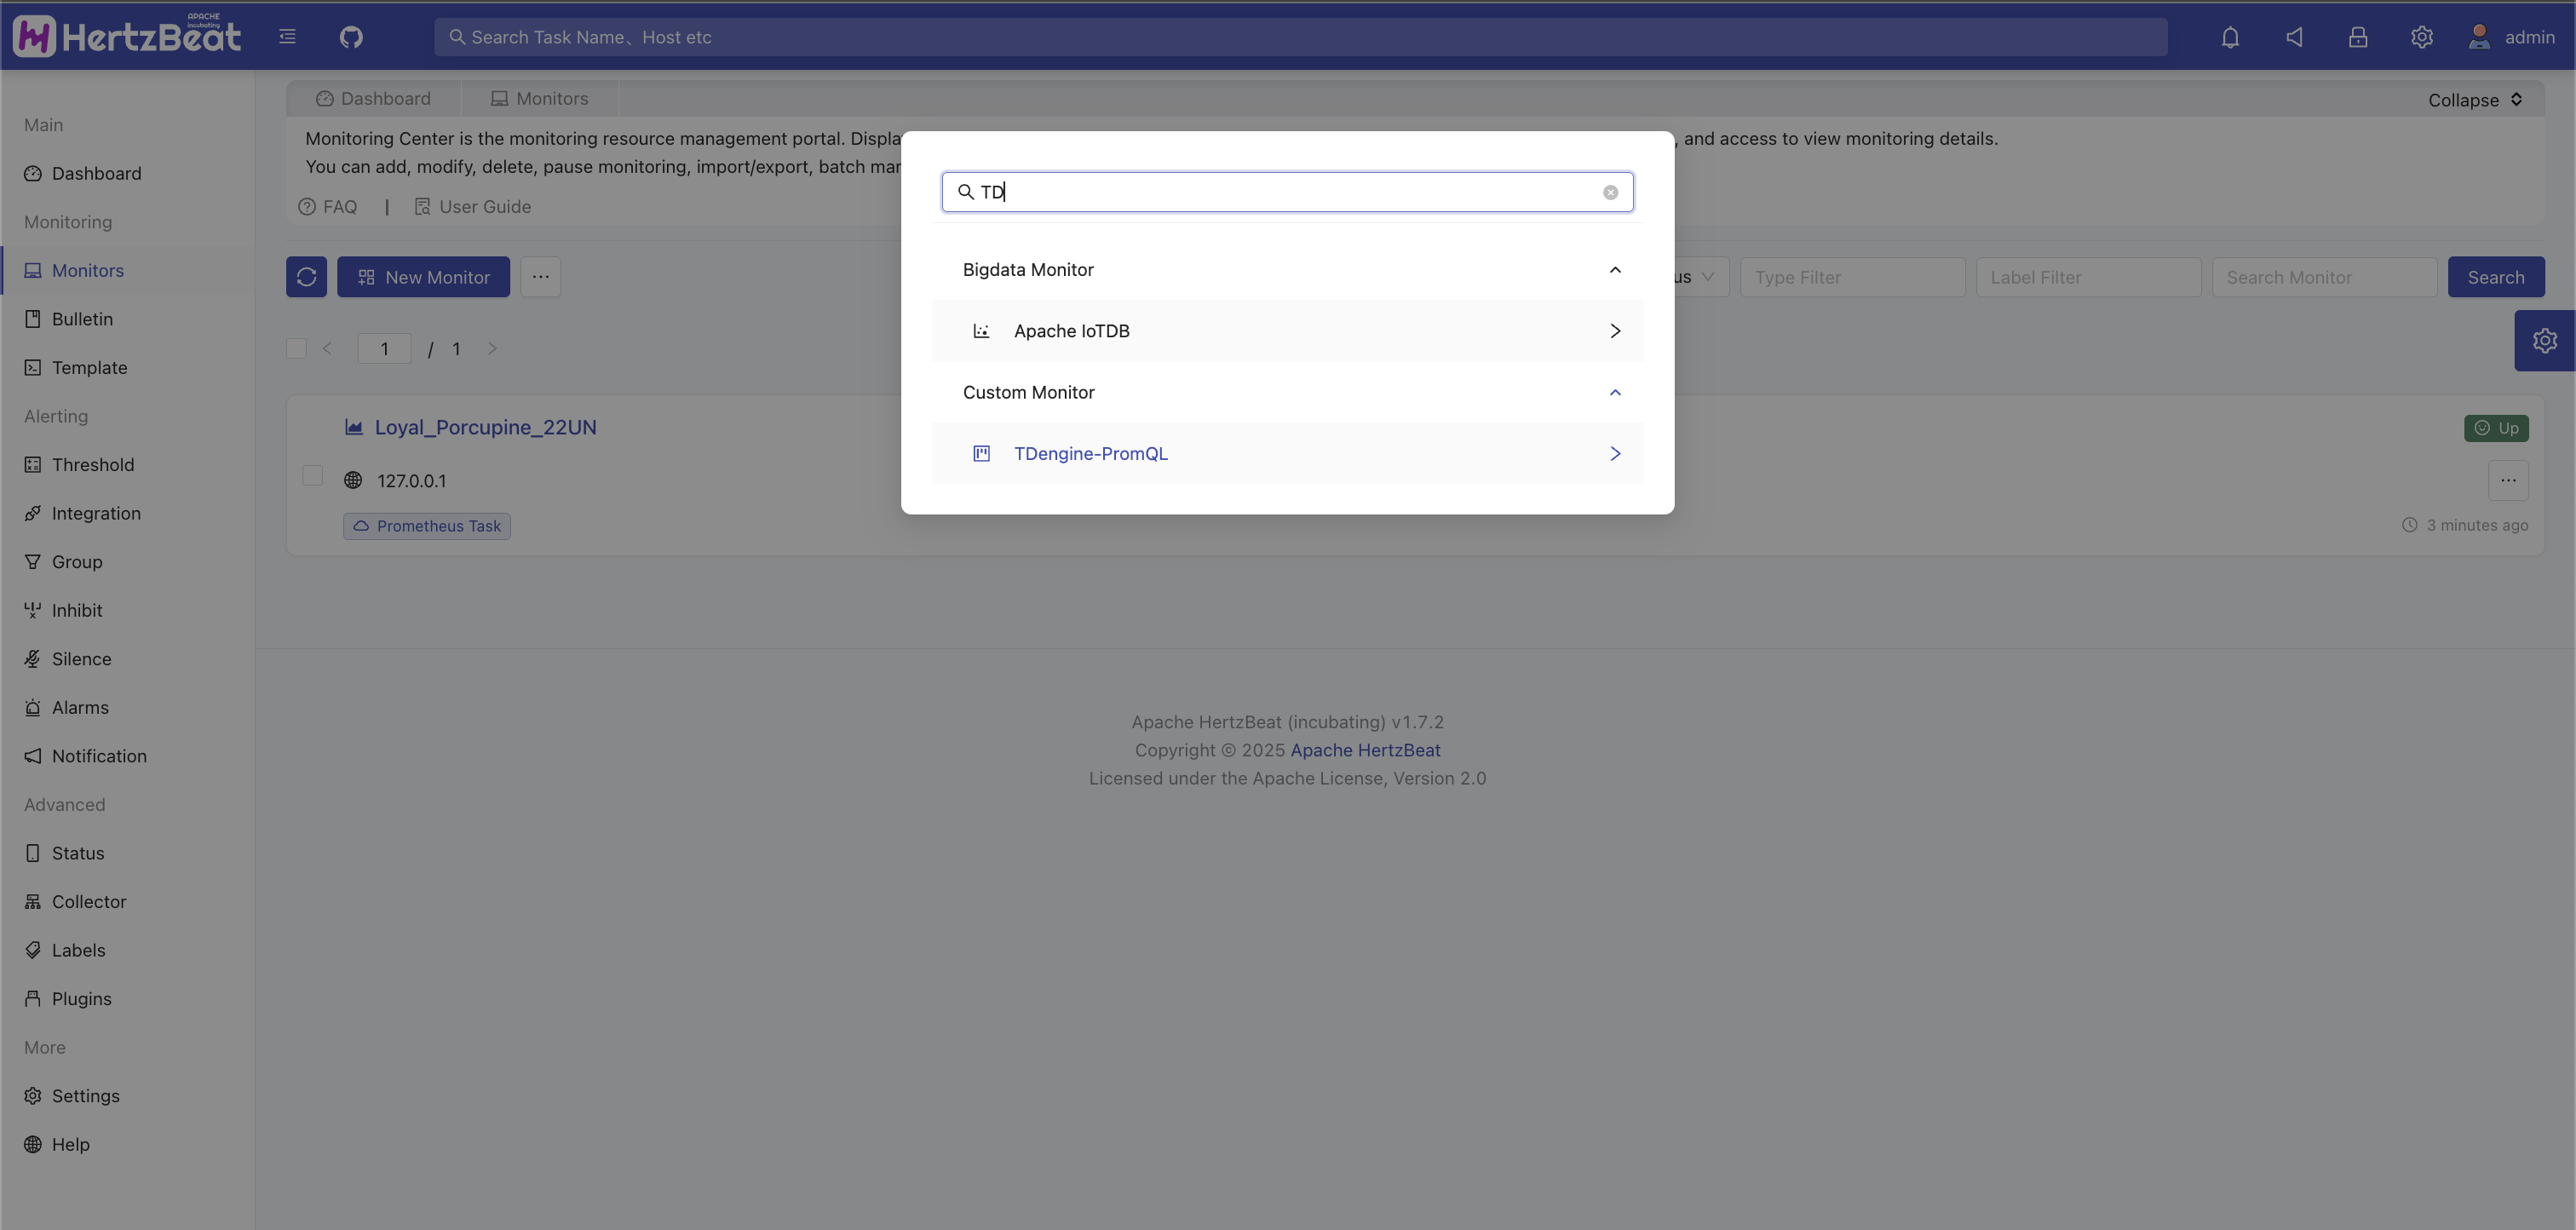
Added TDengine-PromQL monitoring
System Page -> Monitoring Center -> Add Monitoring -> Custom Monitoring -> TDengine-PromQL Task
-
Fill in key parameters
Target Host: Prometheus application server address (without protocol header, e.g., https://, http://)
Port: Prometheus API port, default value: 9090
Endpoint path: The URL for Prometheus to query PromQL. Default value:
/api/v1/queryYou can use tags to categorize tasks, such as adding business-related tags like
env=test.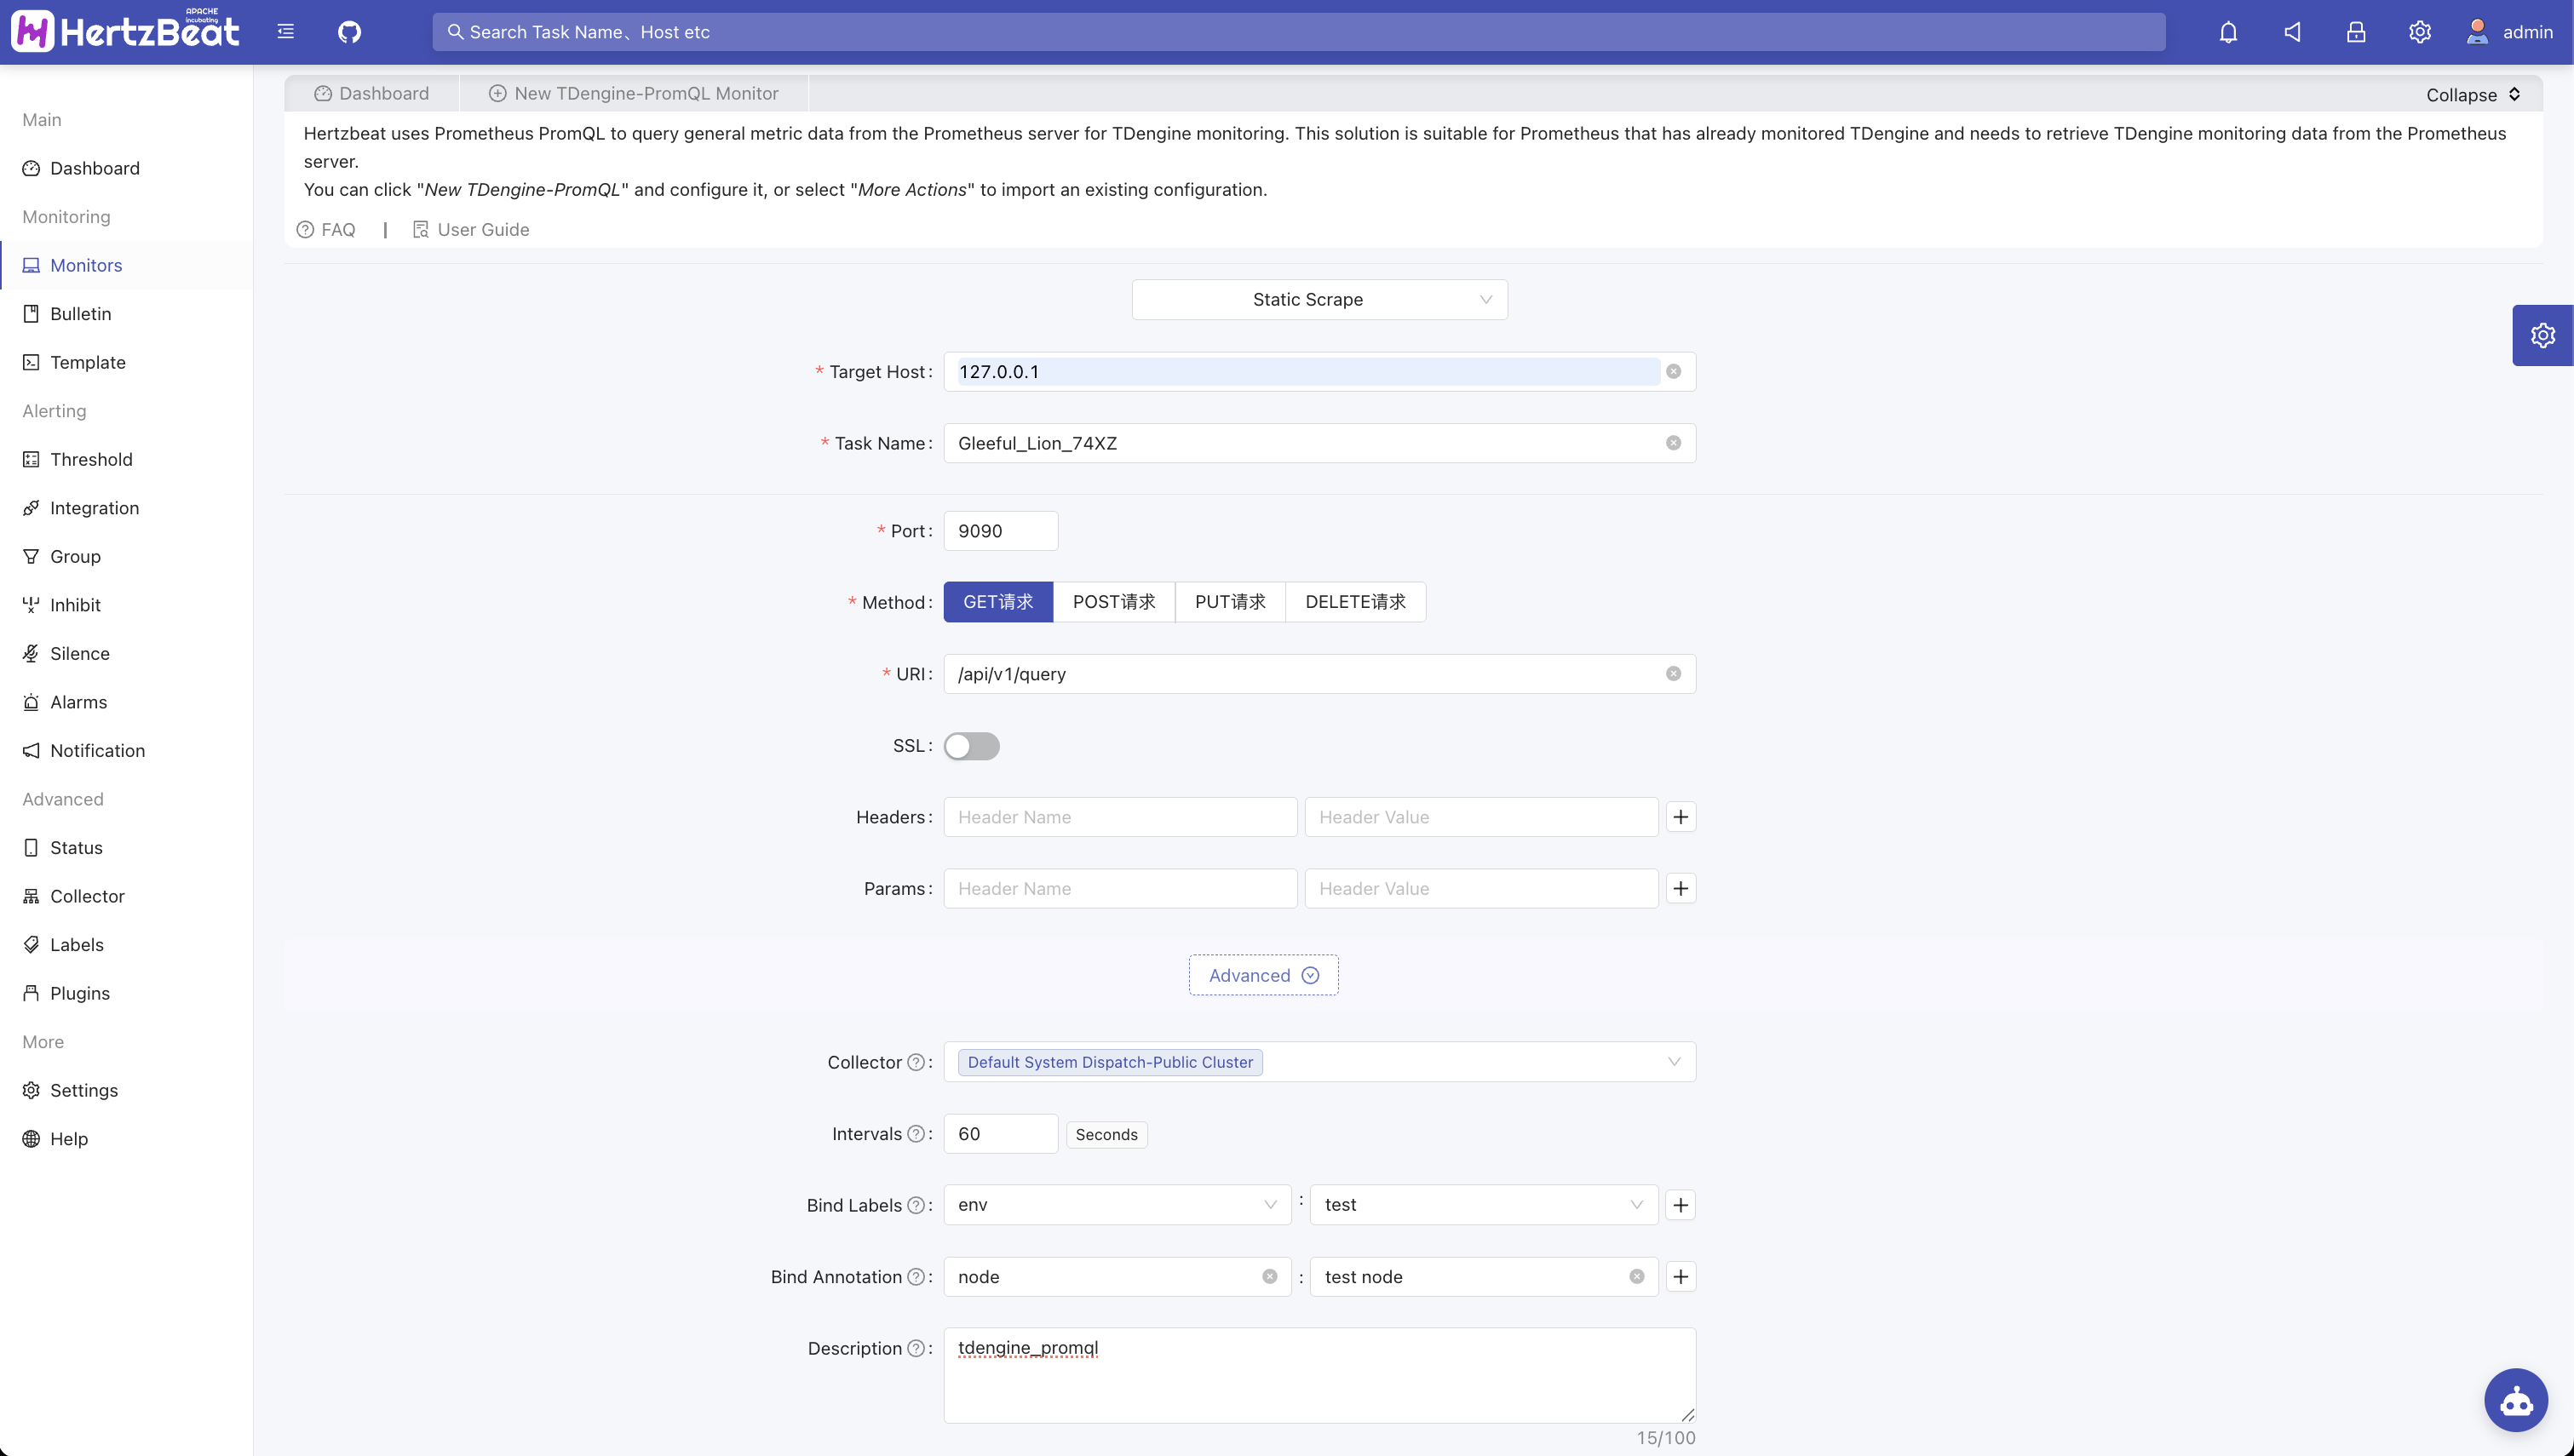
-
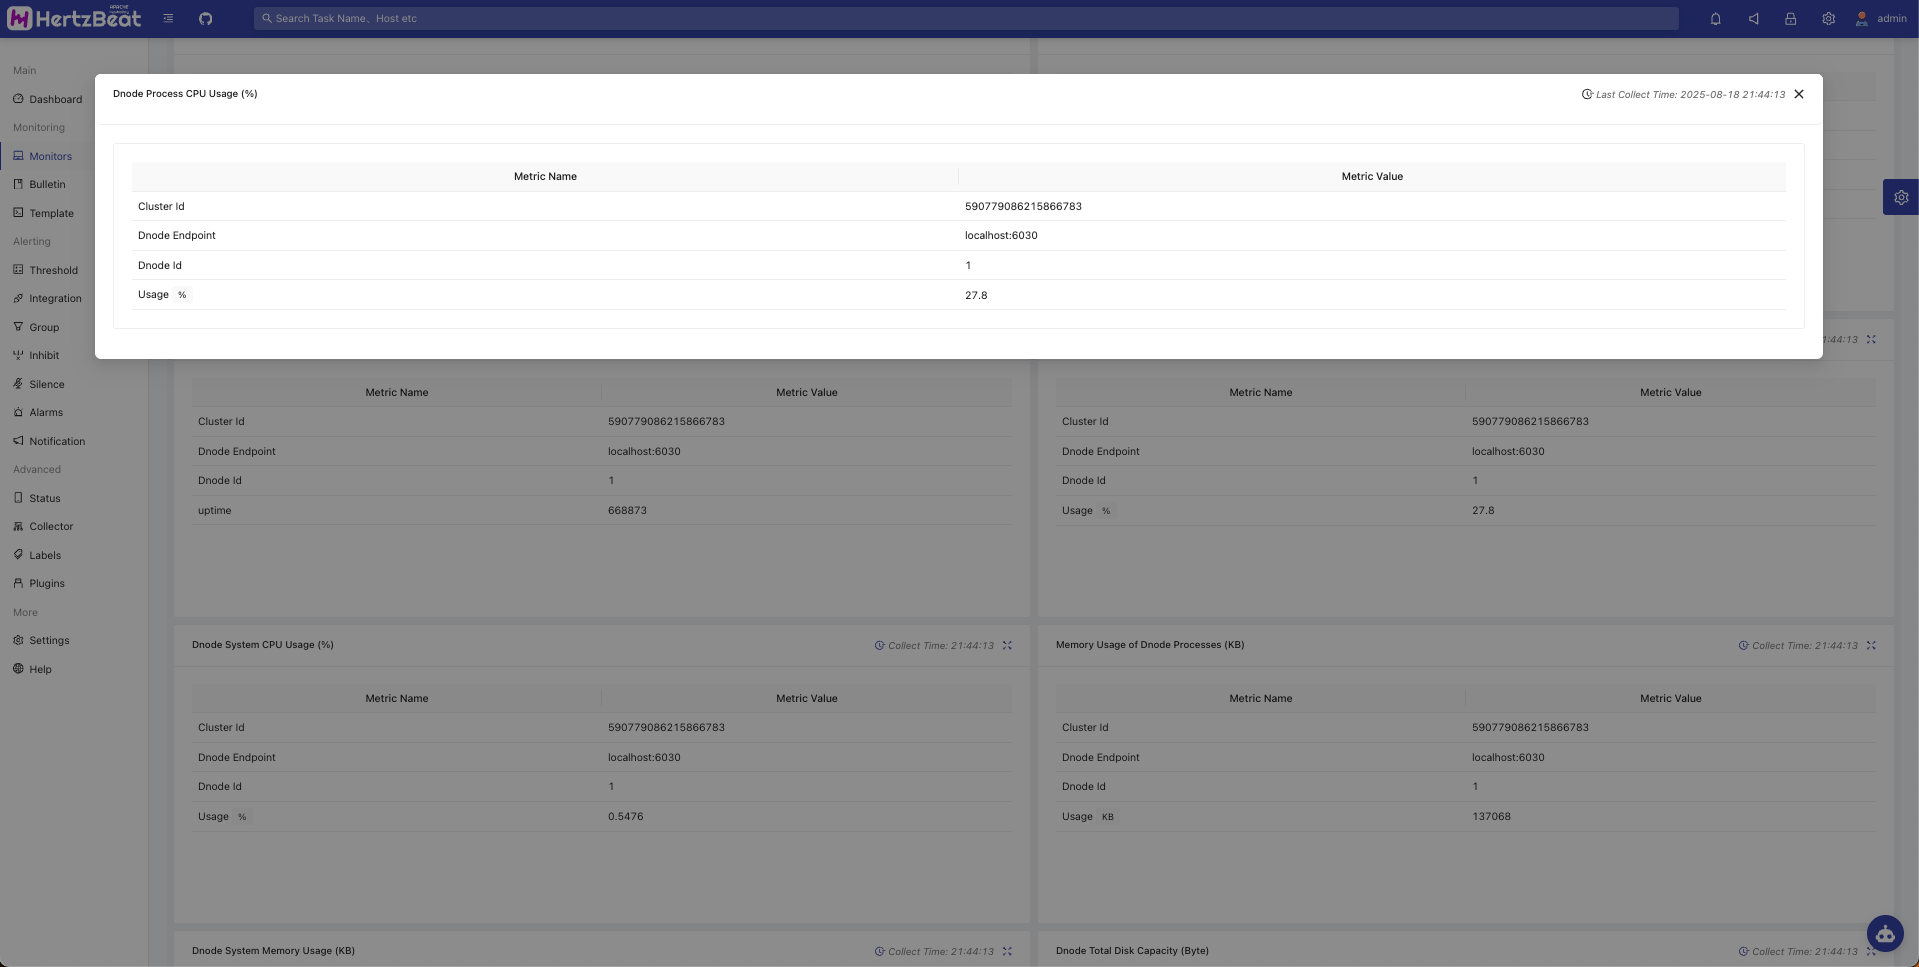
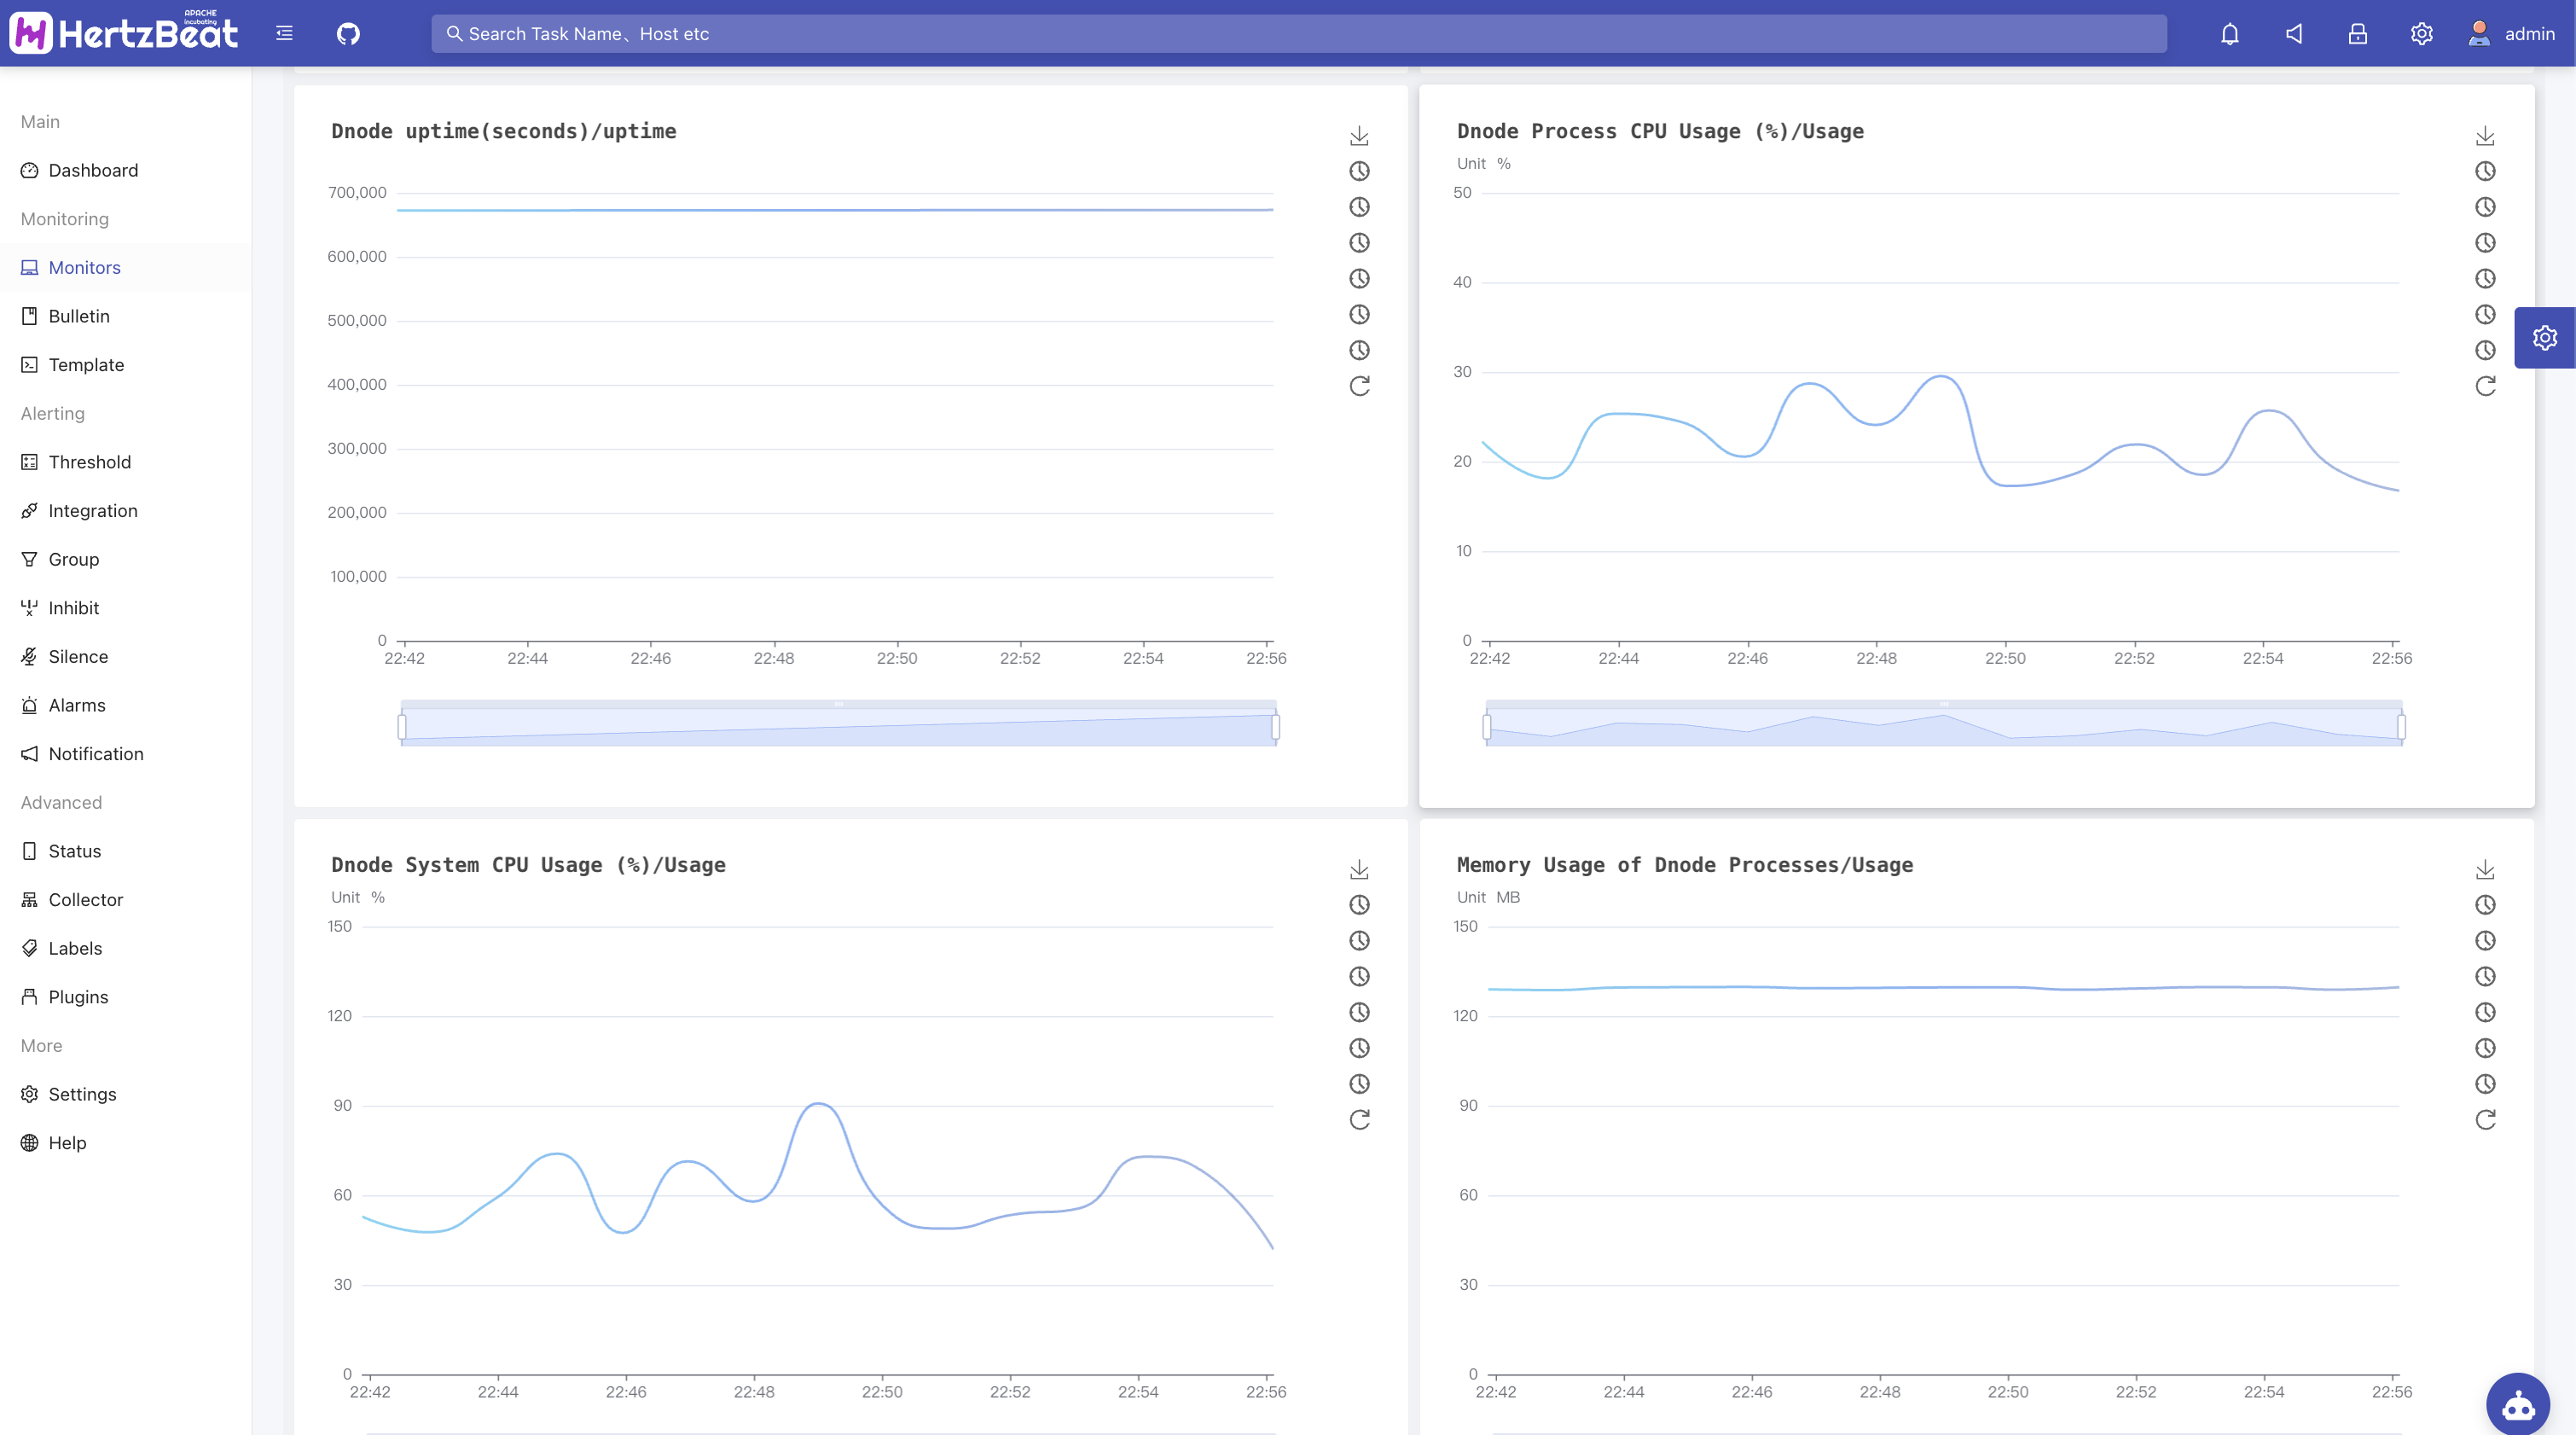
View inspection indicator data
You can view task statuses in the monitoring list and view metric data charts and other information in the monitoring details.
Monitor TDengine(Prometheus)
-
New AUTO monitoring
System Page -> Monitoring Center -> Add Monitoring -> AUTO -> Prometheus Task

-
Fill in key parameters
Target Host taosKeeper service address (without protocol header, e.g., https://, http://)
Port: taosKeeper service port (e.g., 6043)
Endpoint path:
/metricsYou can use tags to categorize tasks, such as adding business-related tags like
env=test.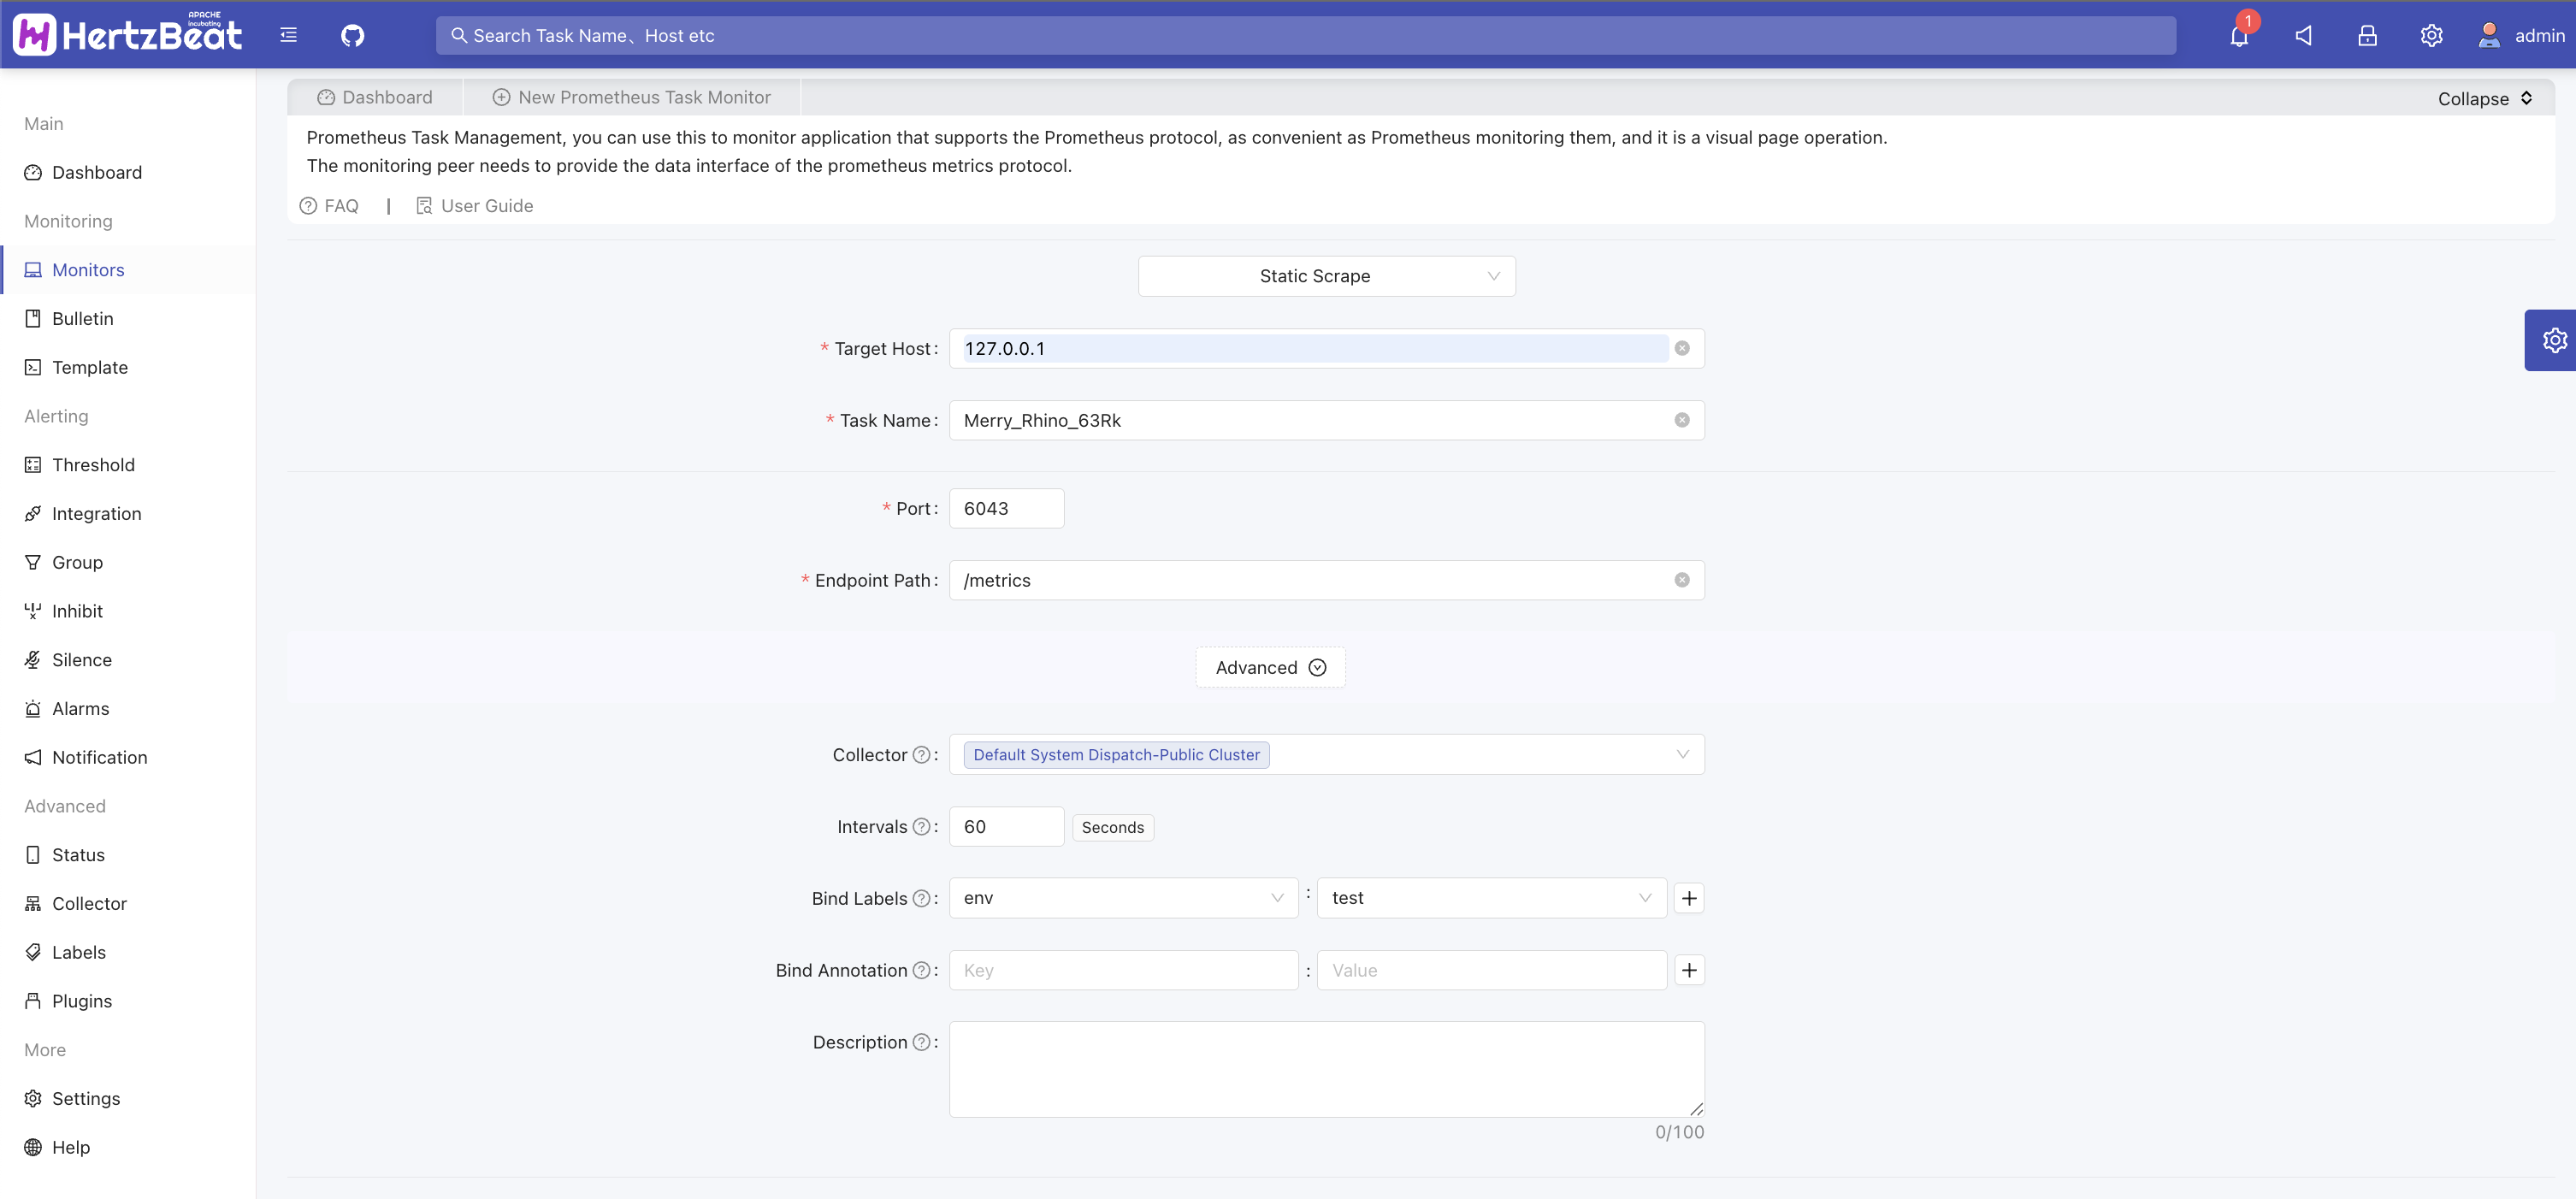
-
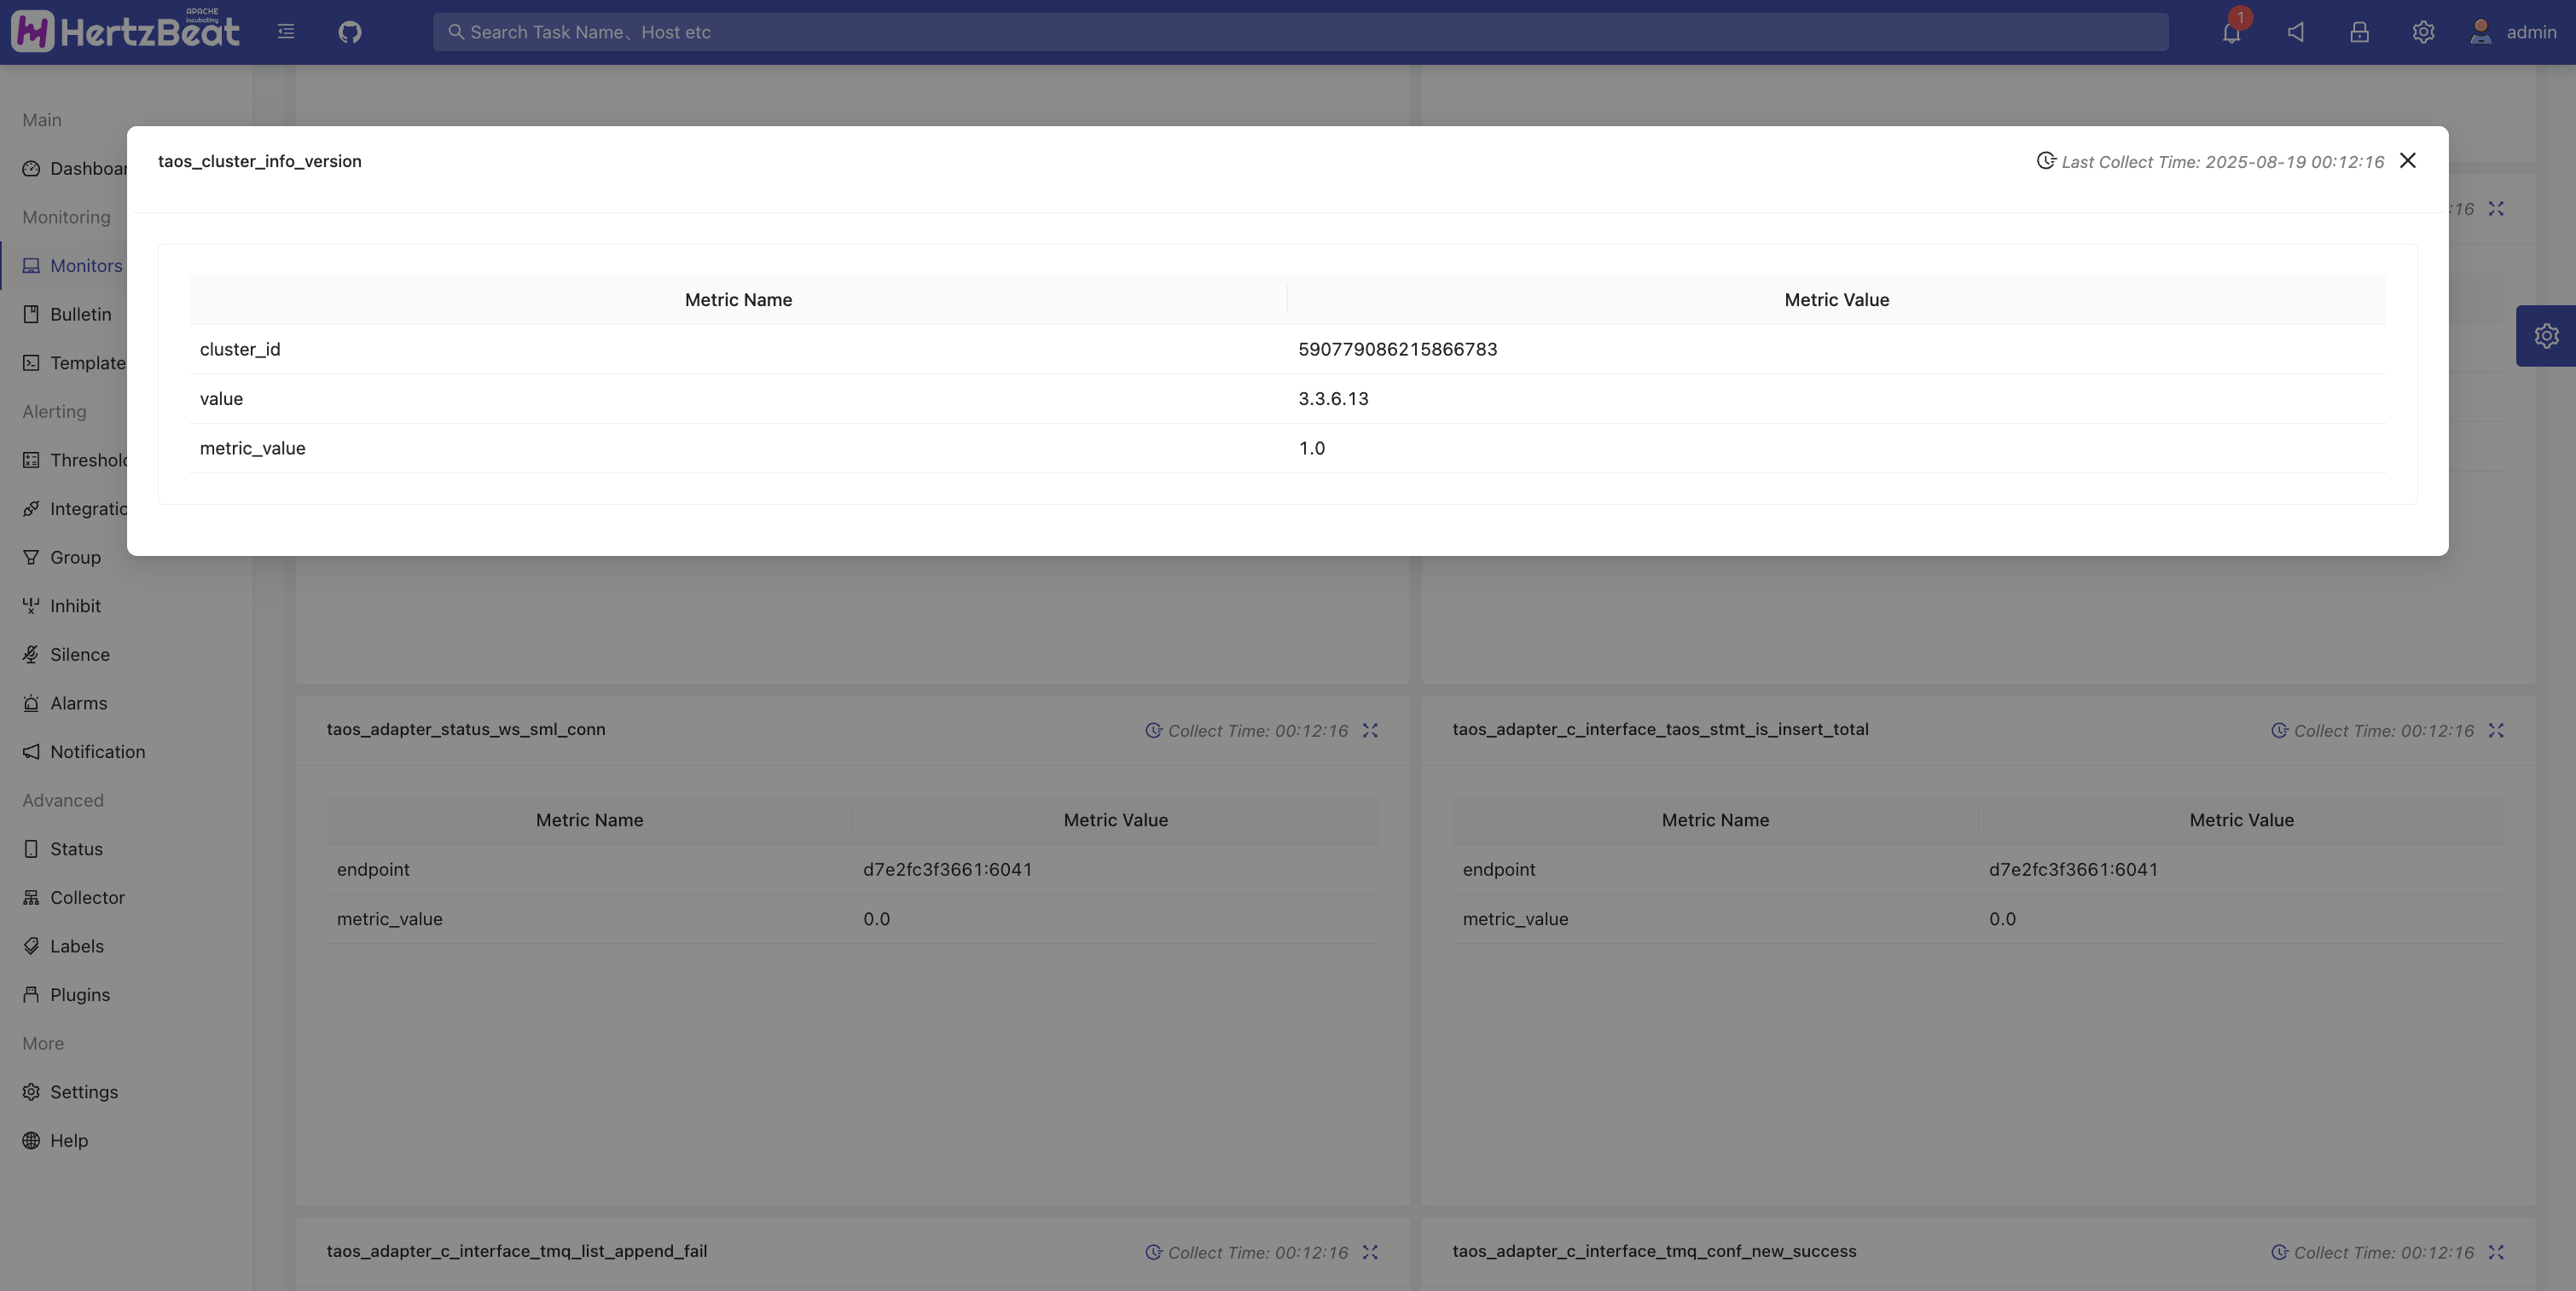
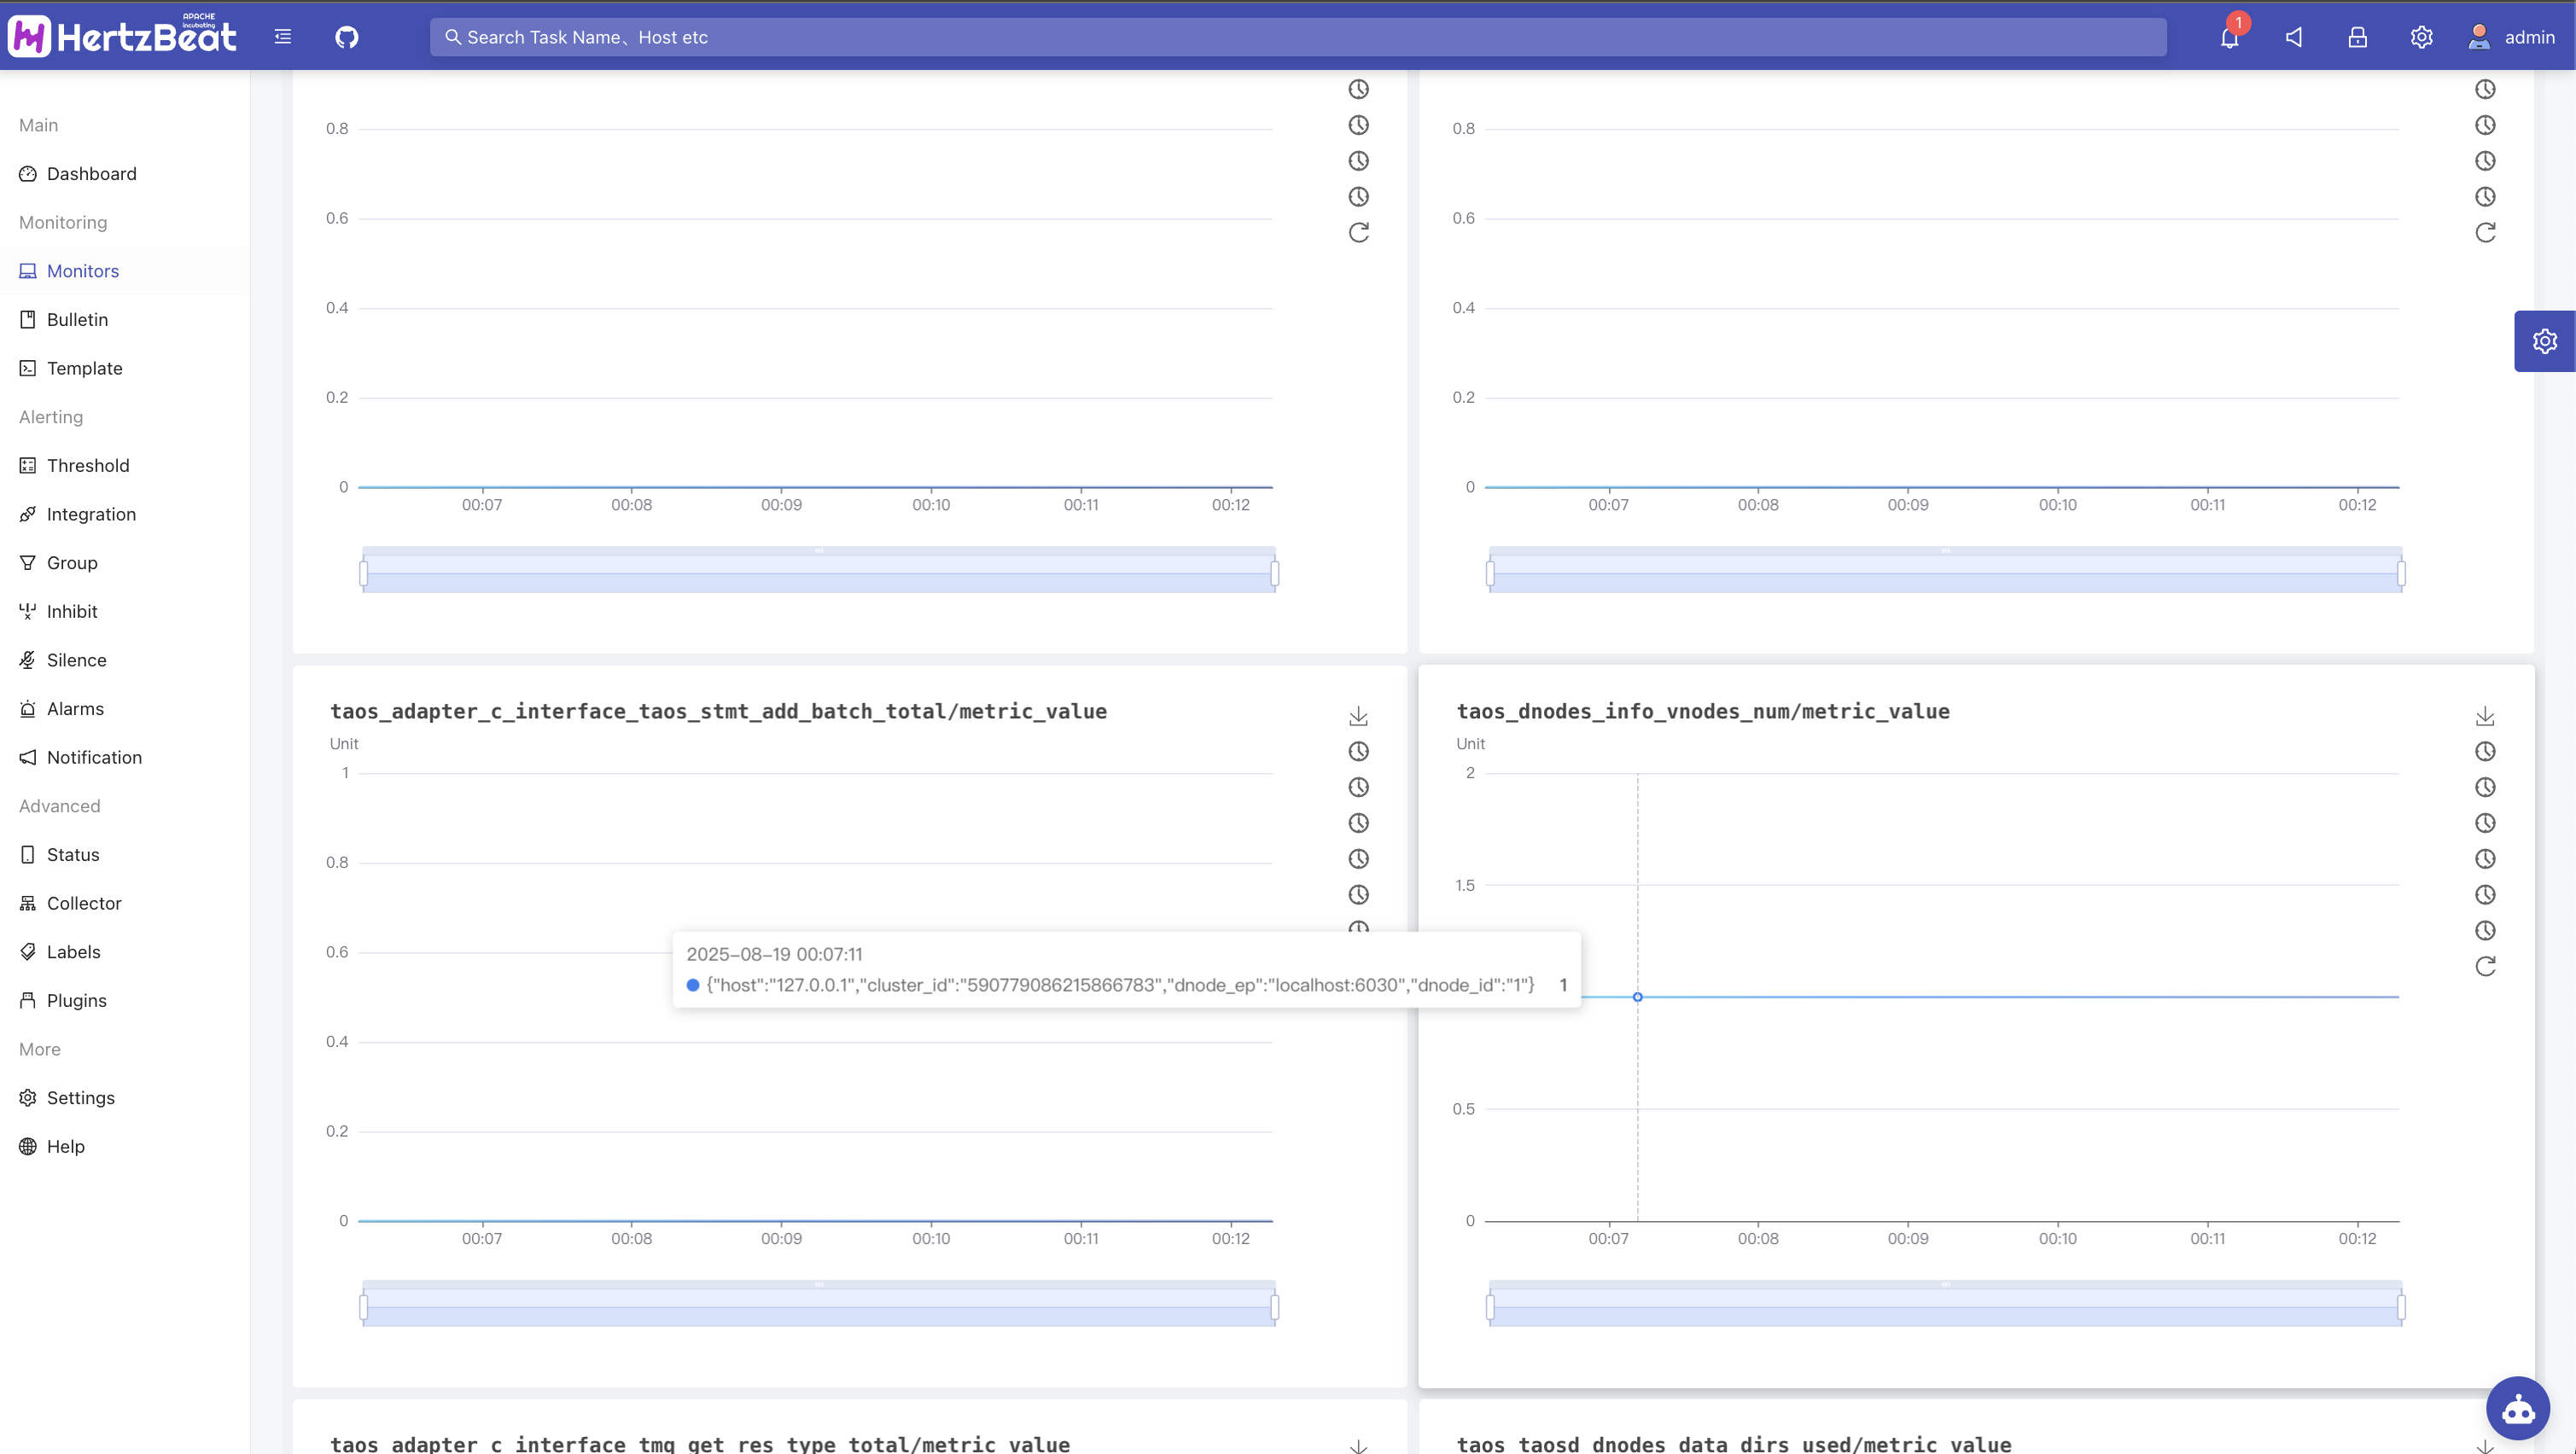
View inspection indicator data
You can view task statuses in the monitoring list and view metric data charts and other information in the monitoring details.
Grafana visualization integration (optional)
-
Grafana chart configuration
You need to enable Grafana's embeddable feature and allow anonymous access.
noteFor complete configuration, please refer to the documentation: Grafana Historical Charts
-
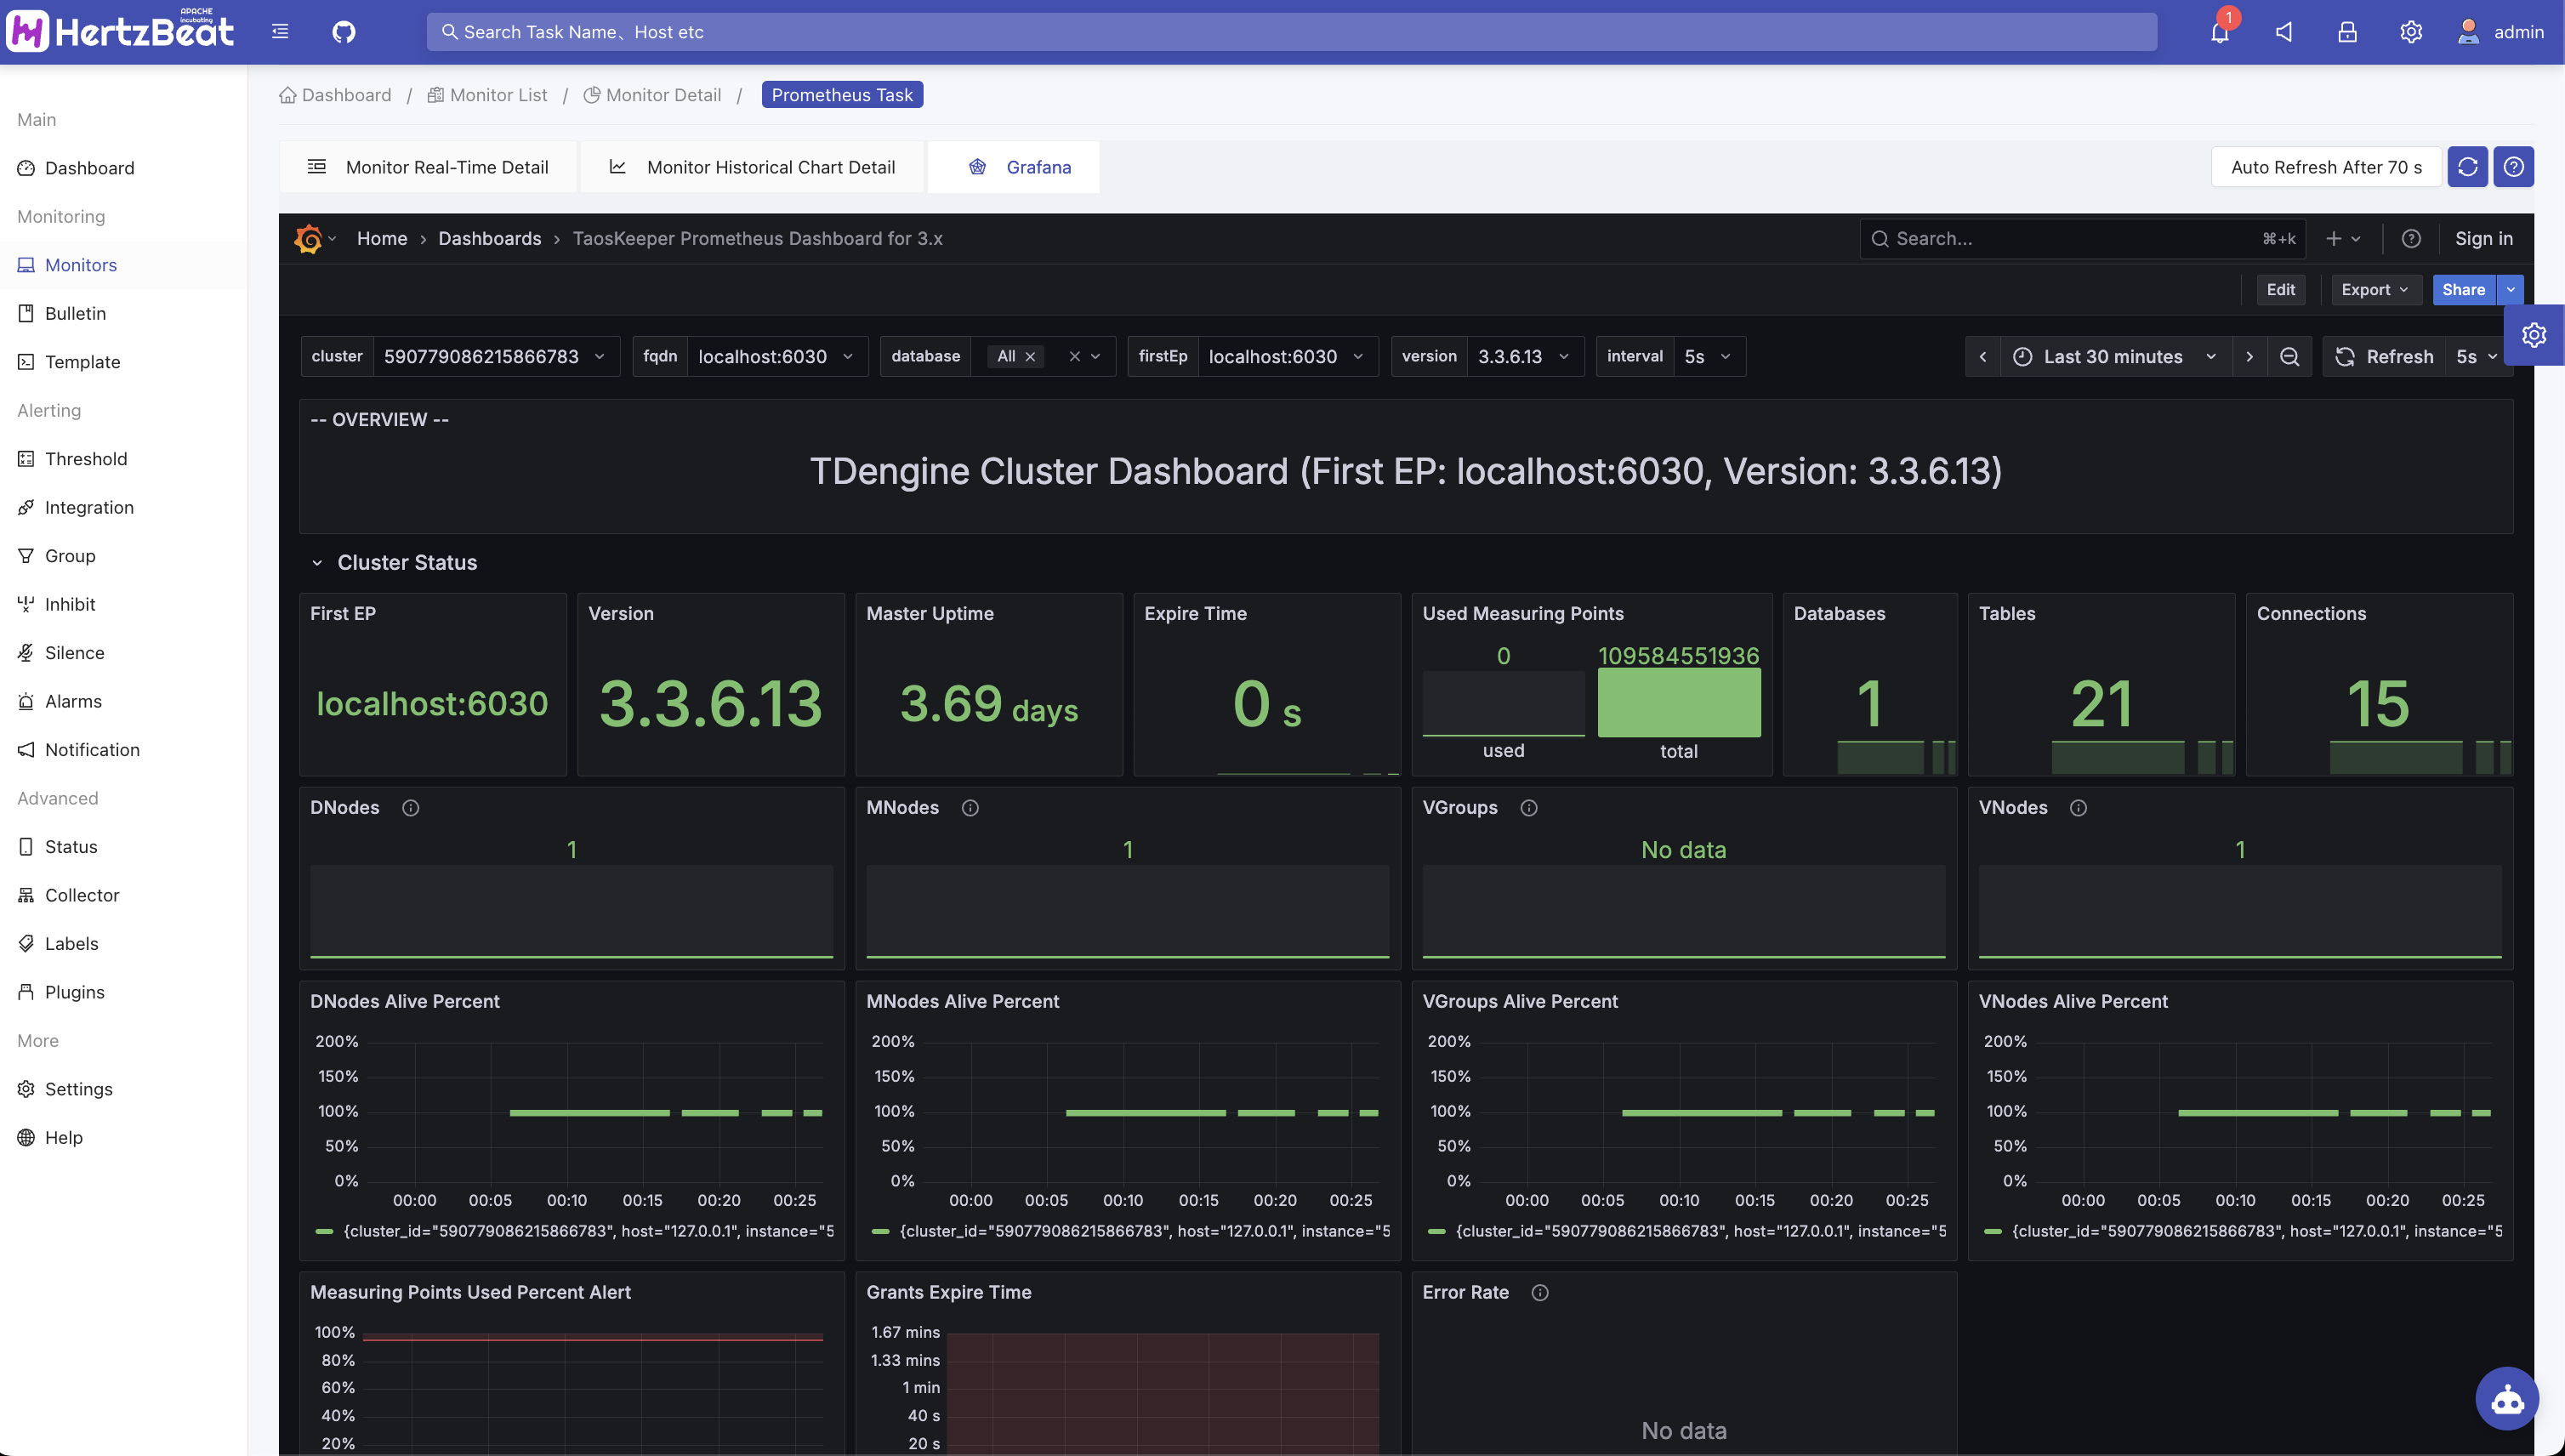
Embedding Grafana dashboards in HertzBeat monitoring
After enabling Grafana, restart the HertzBeat service, enable it in the newly added AUTO monitoring, and upload the Grafana template.
For example: Select the Grafana data source
hertzbeat-victoria-metrics, then click "Share" → "Export" → "Save to file" on the dashboard to download the template and upload it to HertzBeat monitoring. For reference, see: taoskeeper-prometheus-dashboard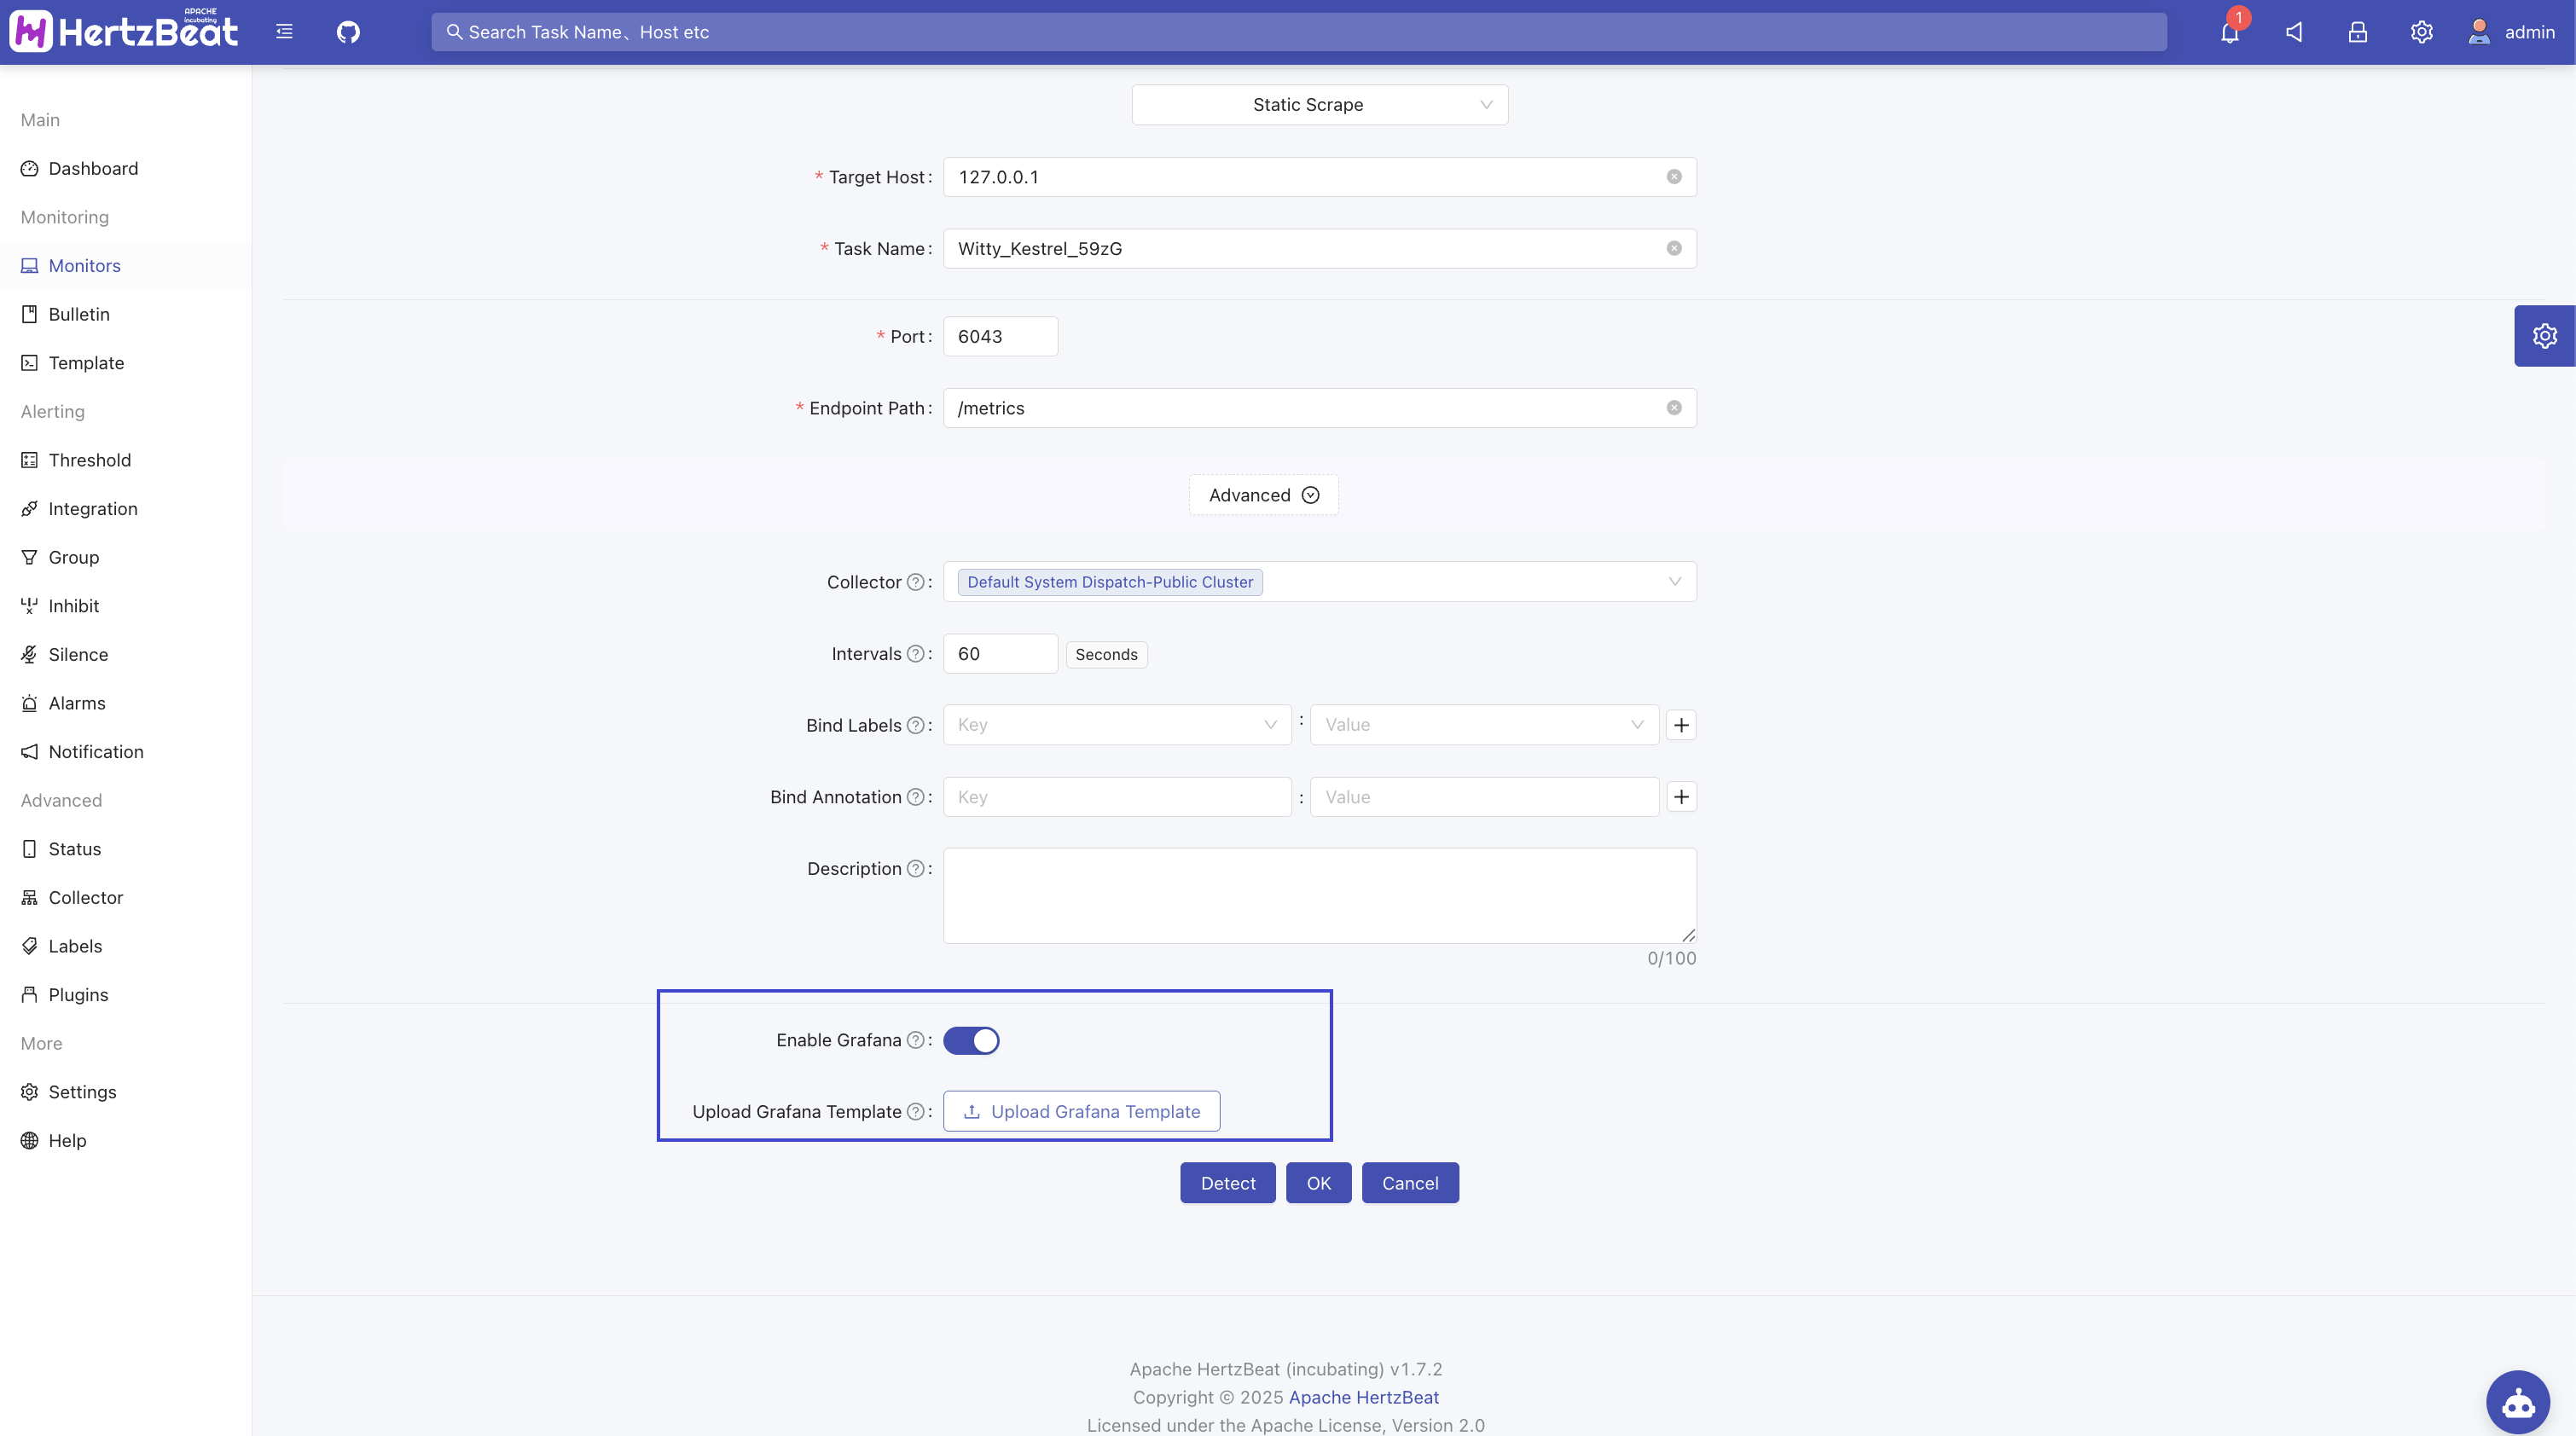
-
View Grafana charts
Go to the new AUTO monitoring page, click the Grafana icon button to view the Grafana chart.
Alarm and notification linkage
-
HertzBeat Alert Configuration
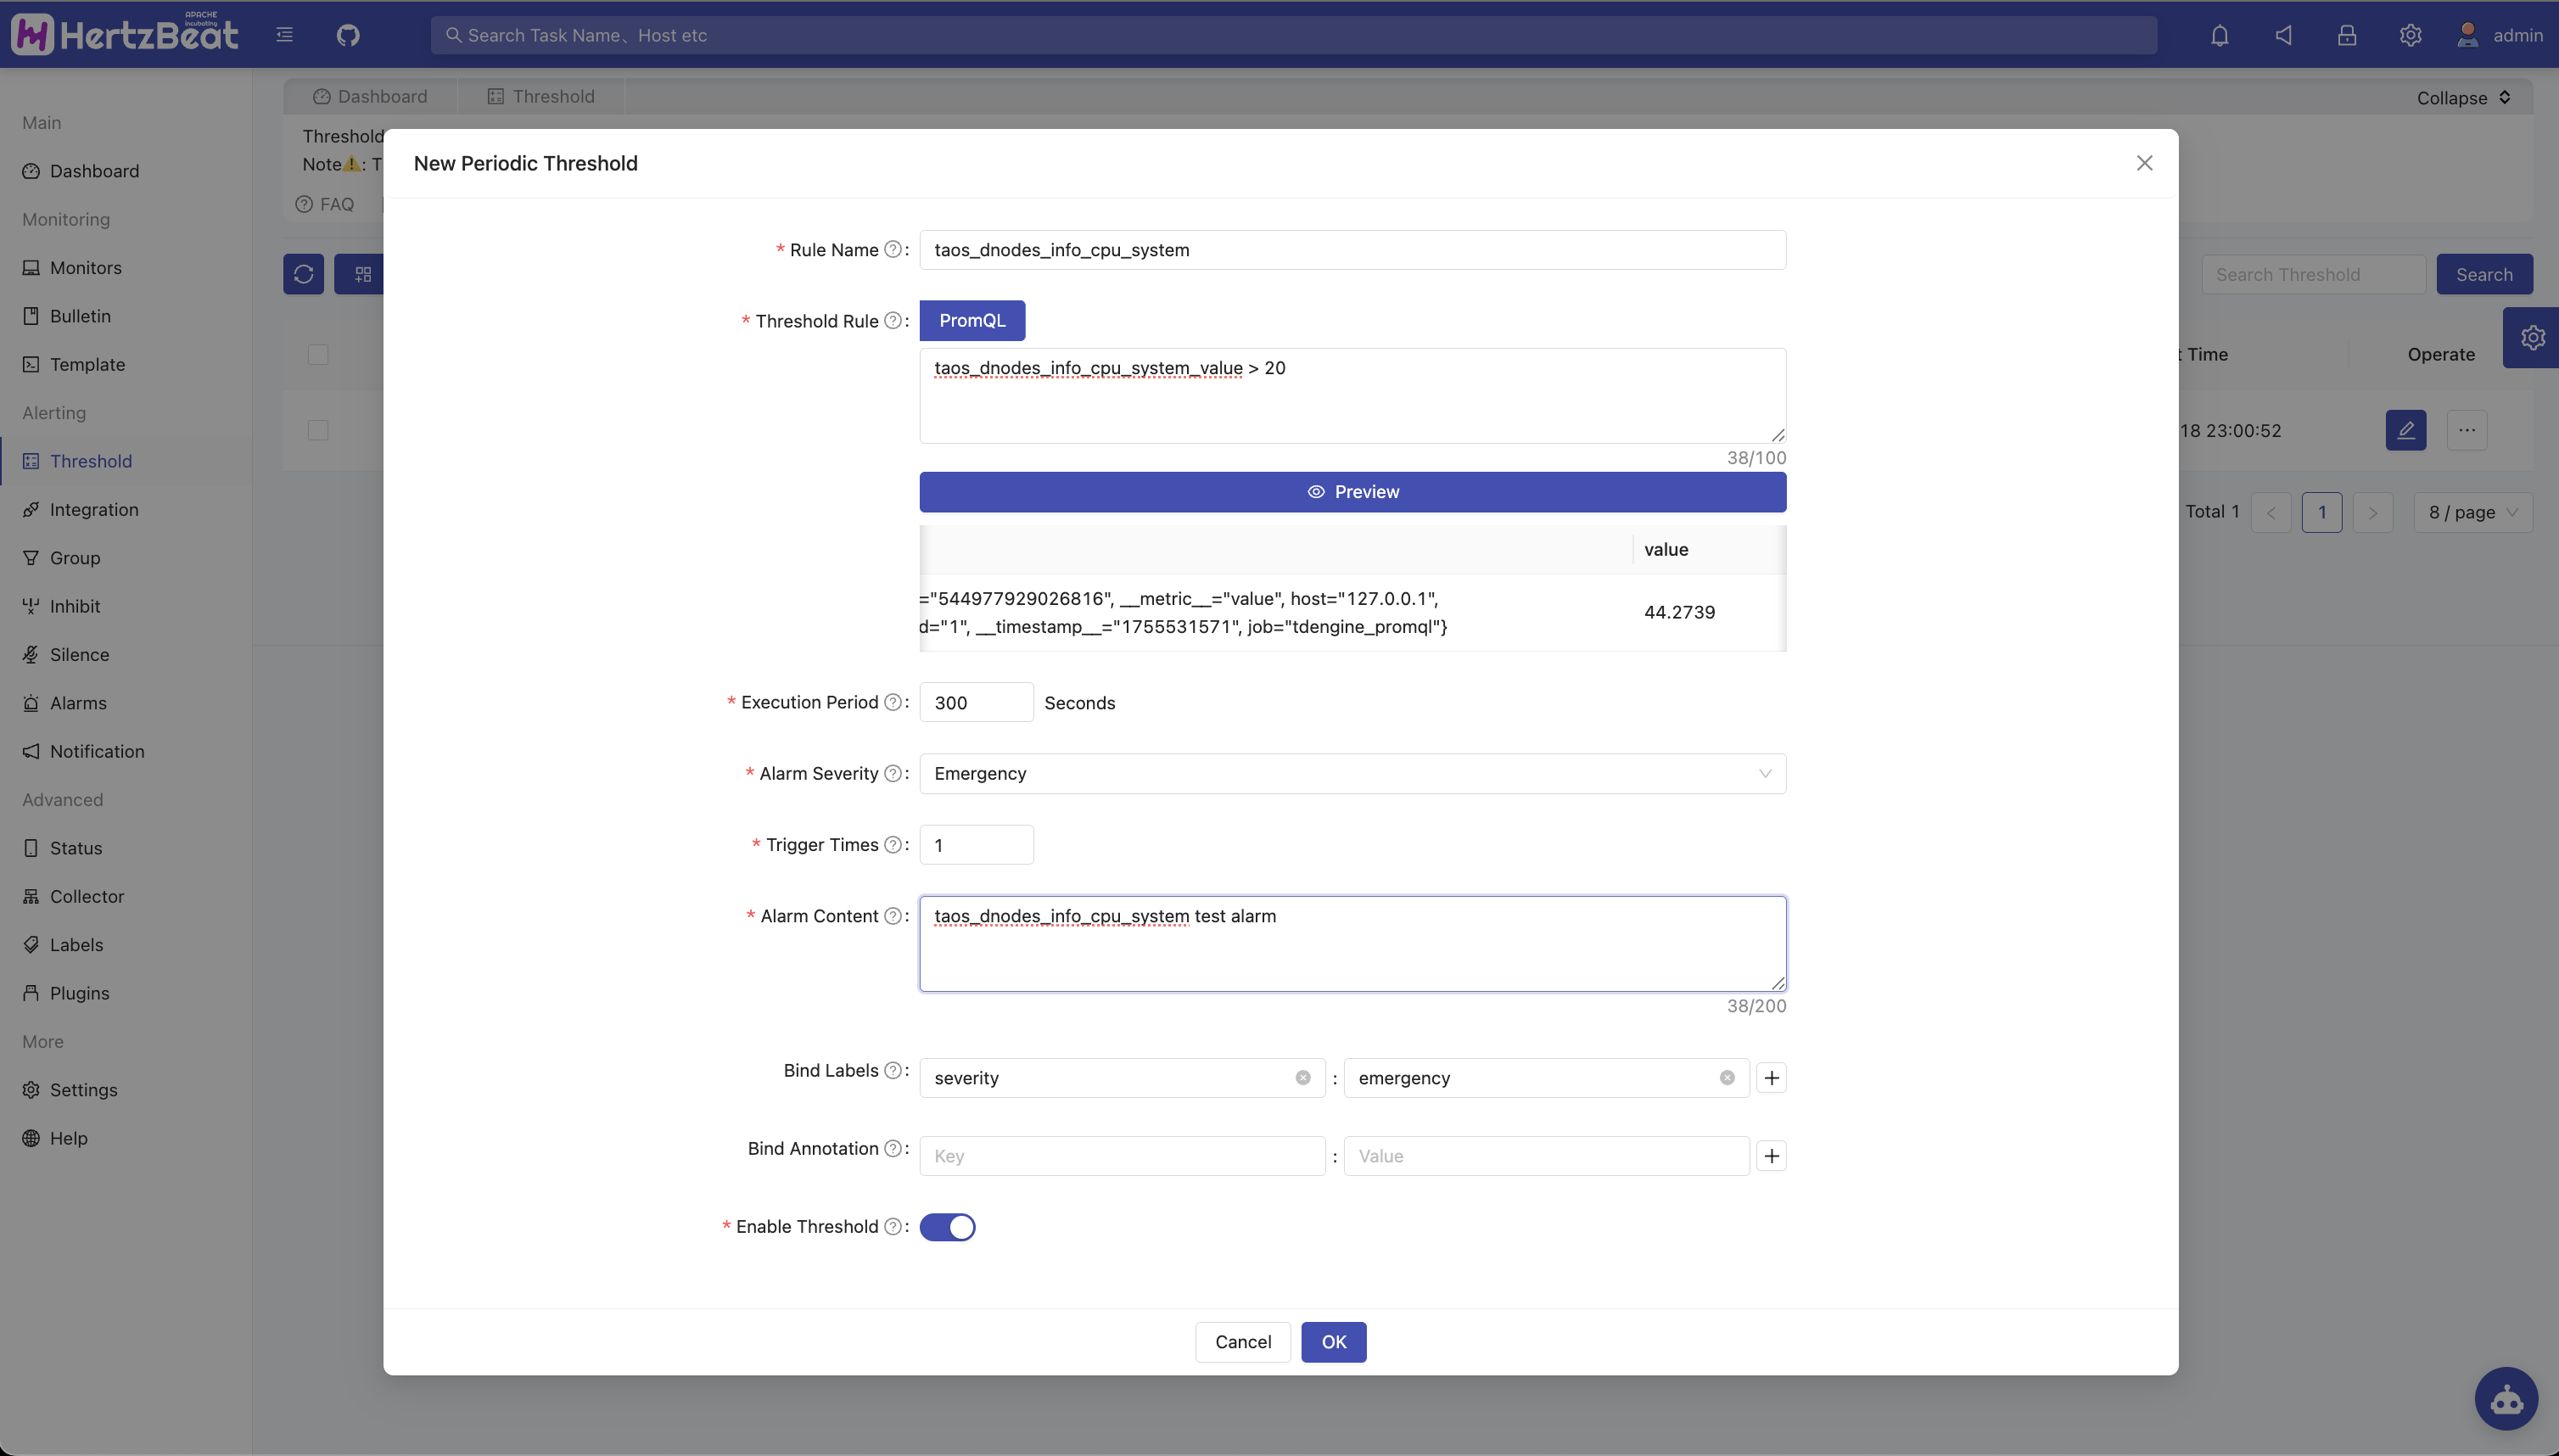
System Page -> Alerts -> Threshold Rules -> Add -> Add Threshold

HertzBeat provides two types of threshold rule settings: real-time calculation and scheduled cycle. Here, we will use the scheduled cycle threshold rule as an example.
- Threshold Name: Threshold rule name
- Threshold rules: Fill in the rules for monitoring indicators (supports
PromQL). - Execution cycle: The time interval for calculating the periodic execution threshold.
- Alarm Level: The alarm level triggered by the threshold, from low to high: Warning, Critical, Emergency.
- Trigger count: Set the threshold number of times the trigger must occur before an alert is sent.
- Alarm content: Fill in the content of the monitoring alarm (supports filling in variables)
-
Set threshold rules
For example, to monitor the CPU percentage used by the Dnode node system, add a threshold rule:
taos_dnodes_info_cpu_system_value > 20There are many combinations of threshold rules that can be set, and users can set more detailed alert rules according to their needs.
Finally, you can see the triggered alerts in the Alert Center.

-
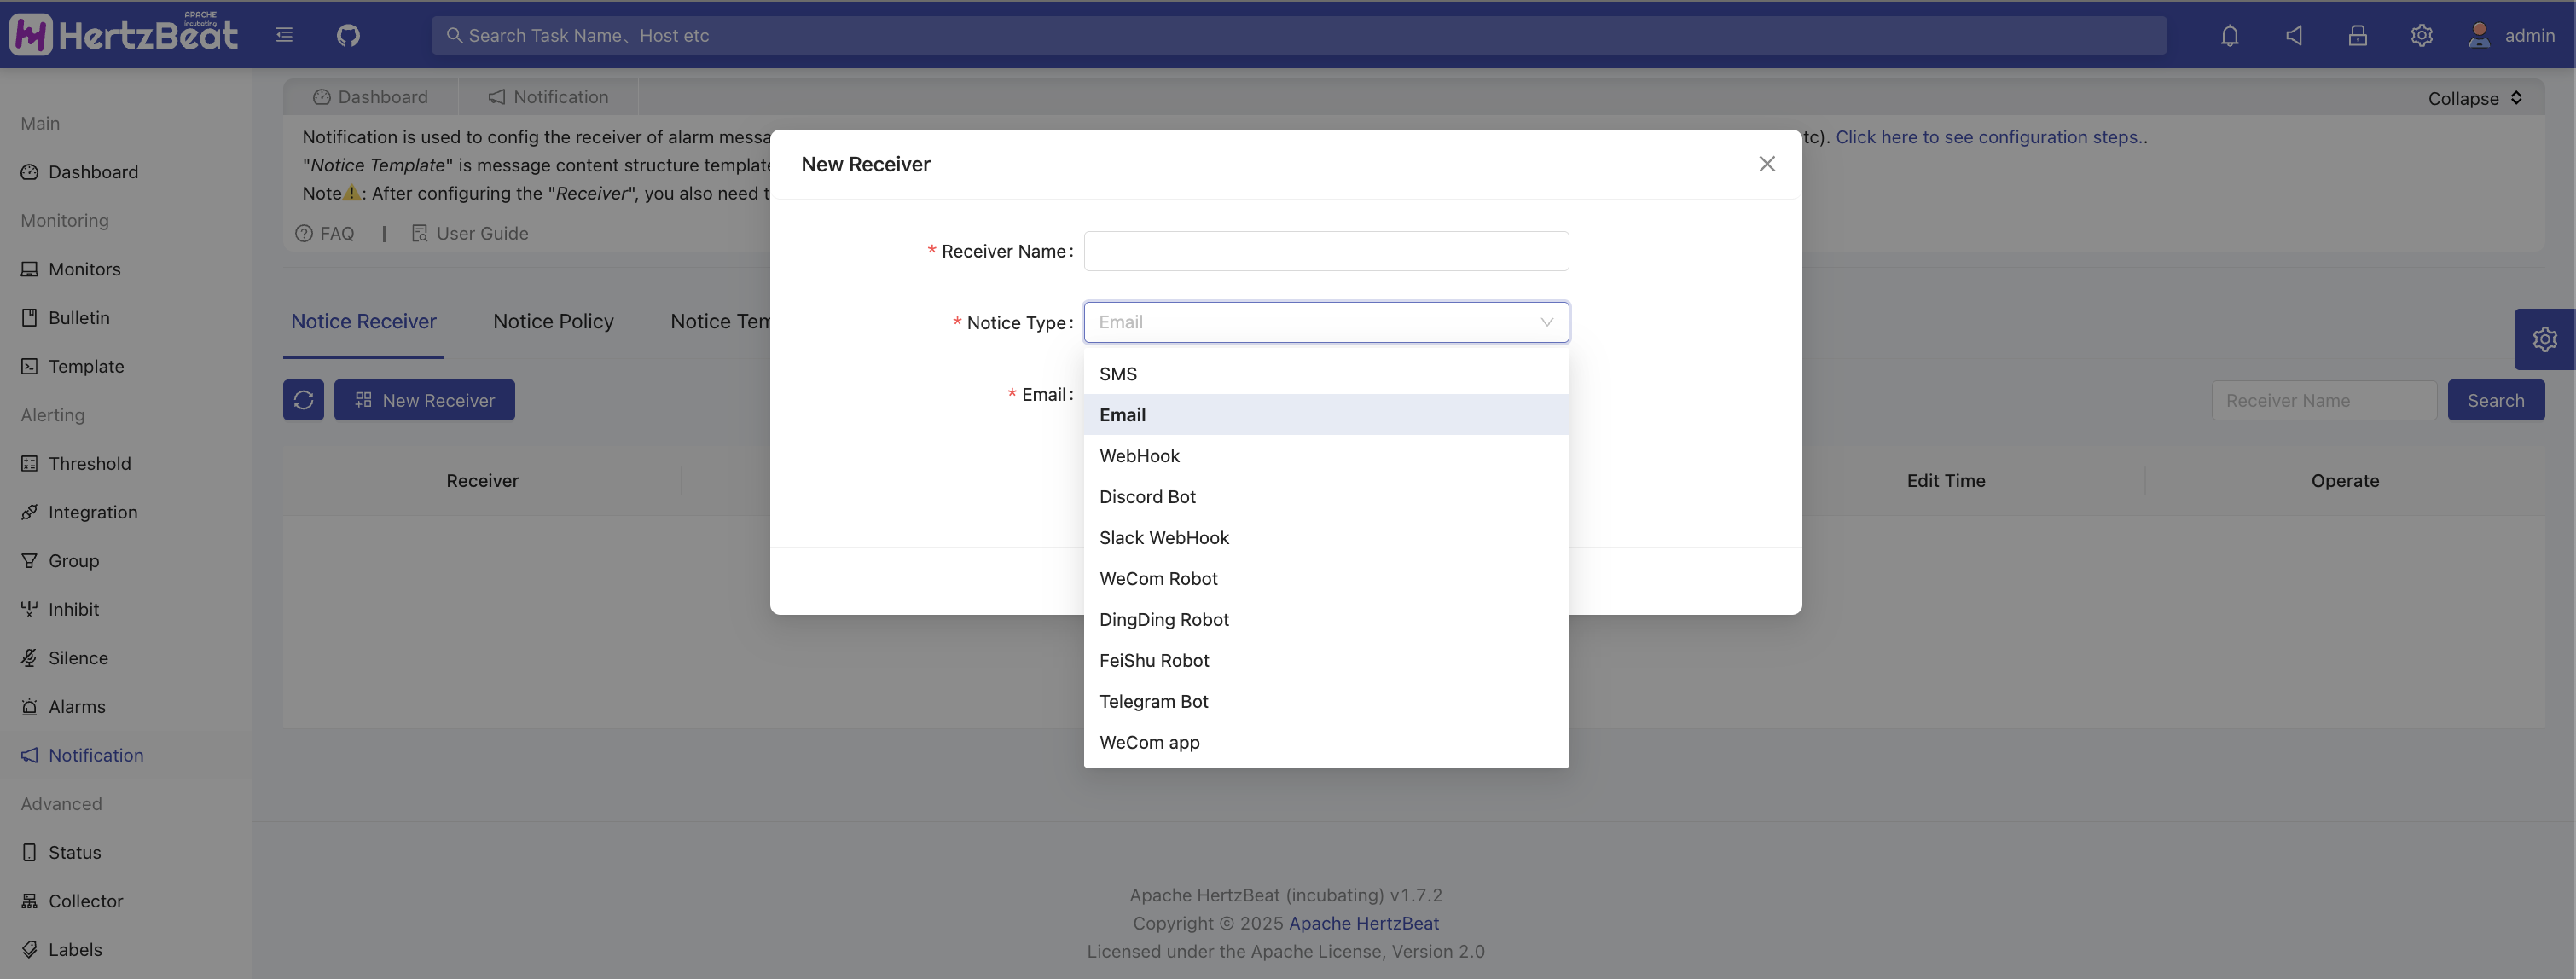
Alert notification
System Page -> Message Notifications -> Notification Media -> Add New Recipient
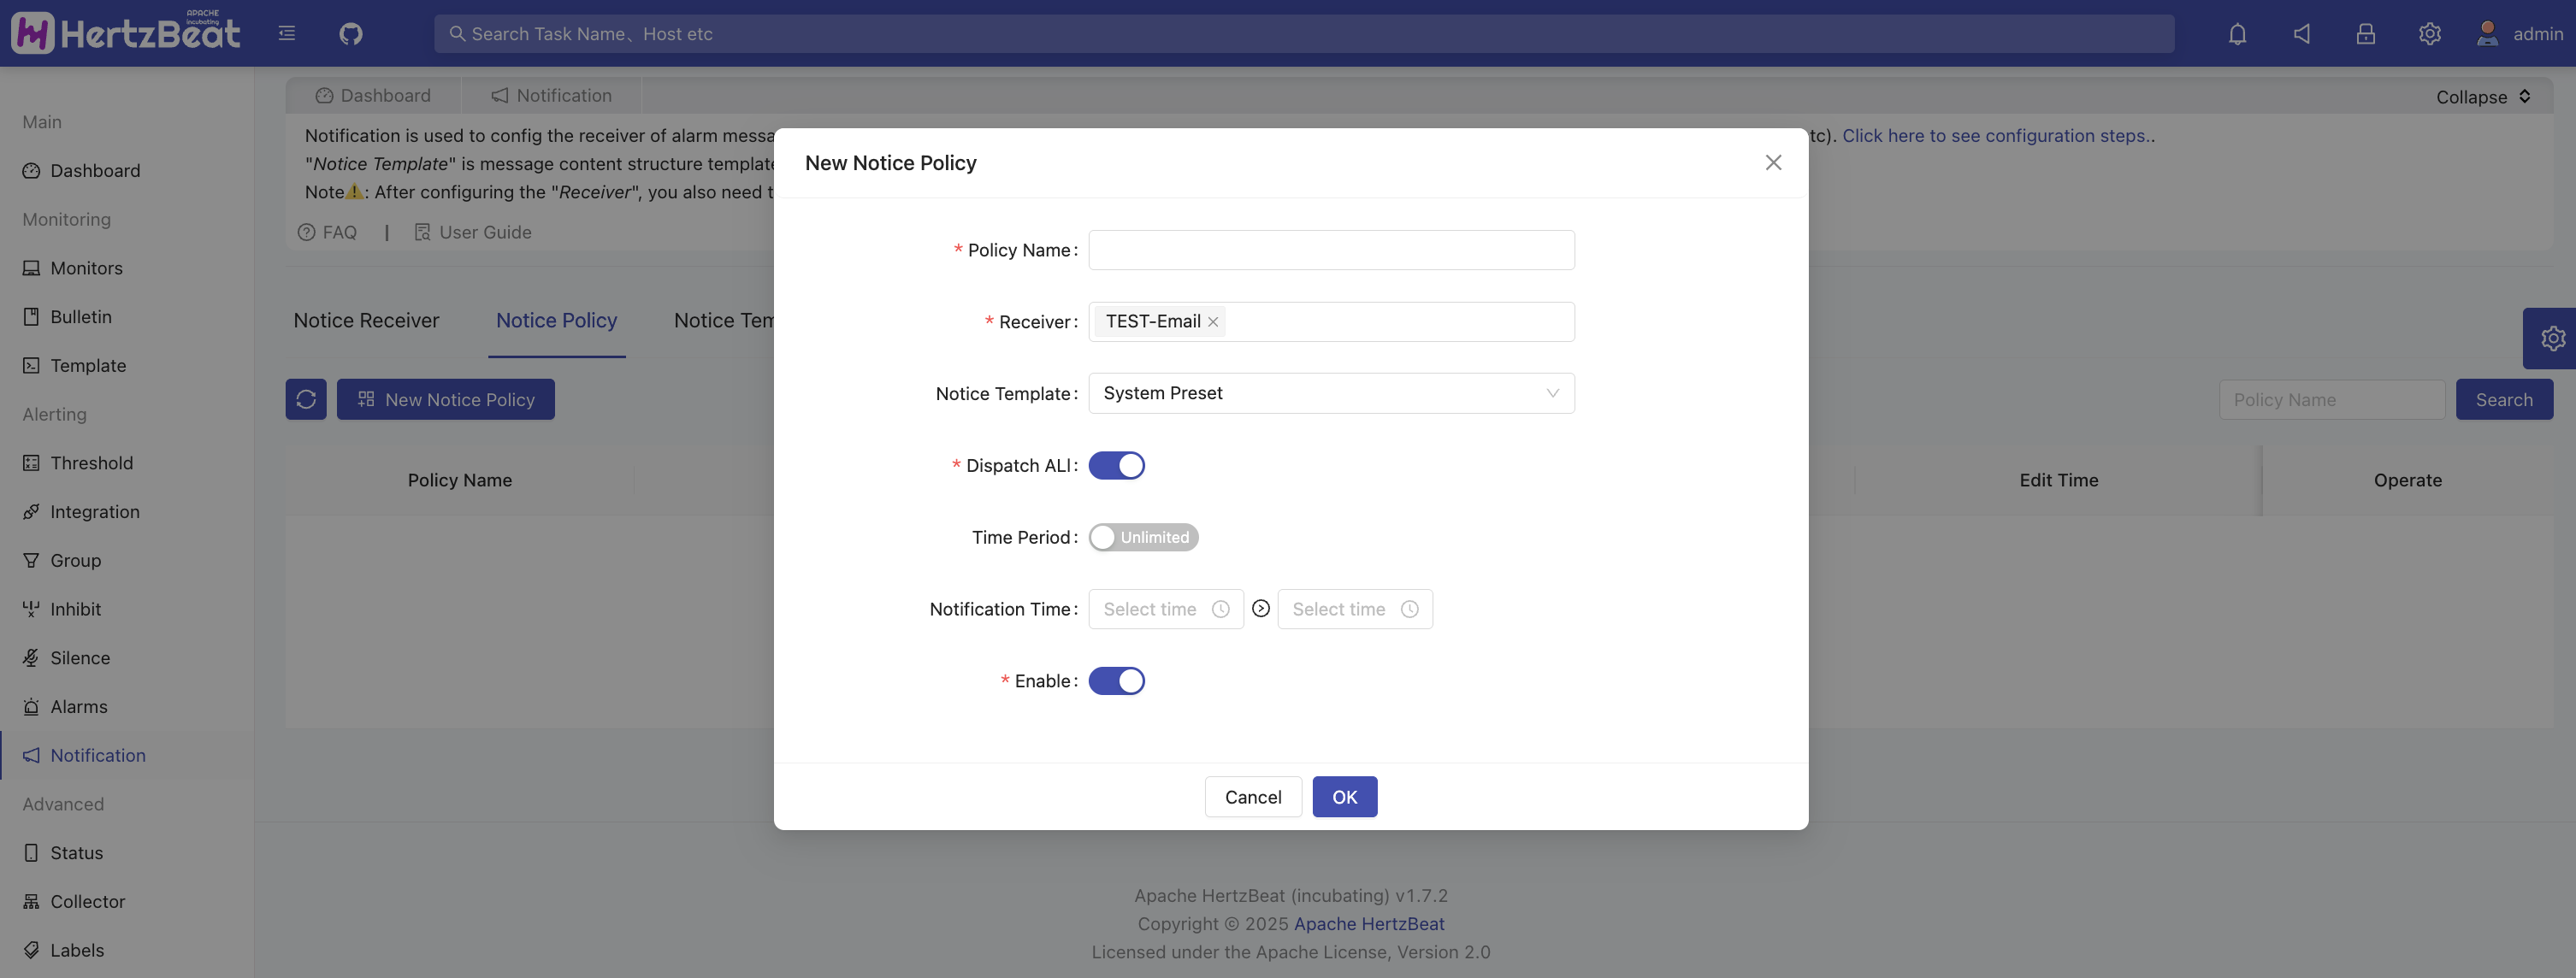
System Page -> Message Notifications -> Notification Policies -> Add Notification Policy -> Select recipients and enable notifications
-
OK! When the threshold rule is triggered, we will receive the corresponding alert message. If no notification is configured, you can also view the alert information in the alert center.
Summary
That concludes our practical guide to monitoring TDengine applications. Of course, this feature is just the tip of the iceberg for HertzBeat. If you like this open-source project, please give it a star on GitHub or Gitee. Your stars are what motivate us to keep improving! Please light up the little stars ✨
Making monitoring simpler, we look forward to building an ecosystem with you! 💝